
Incident Management
End-to-end incident lifecycle management from reporting to investigation to closure.
Respond Faster. Investigate Deeper. Prevent Recurrence.
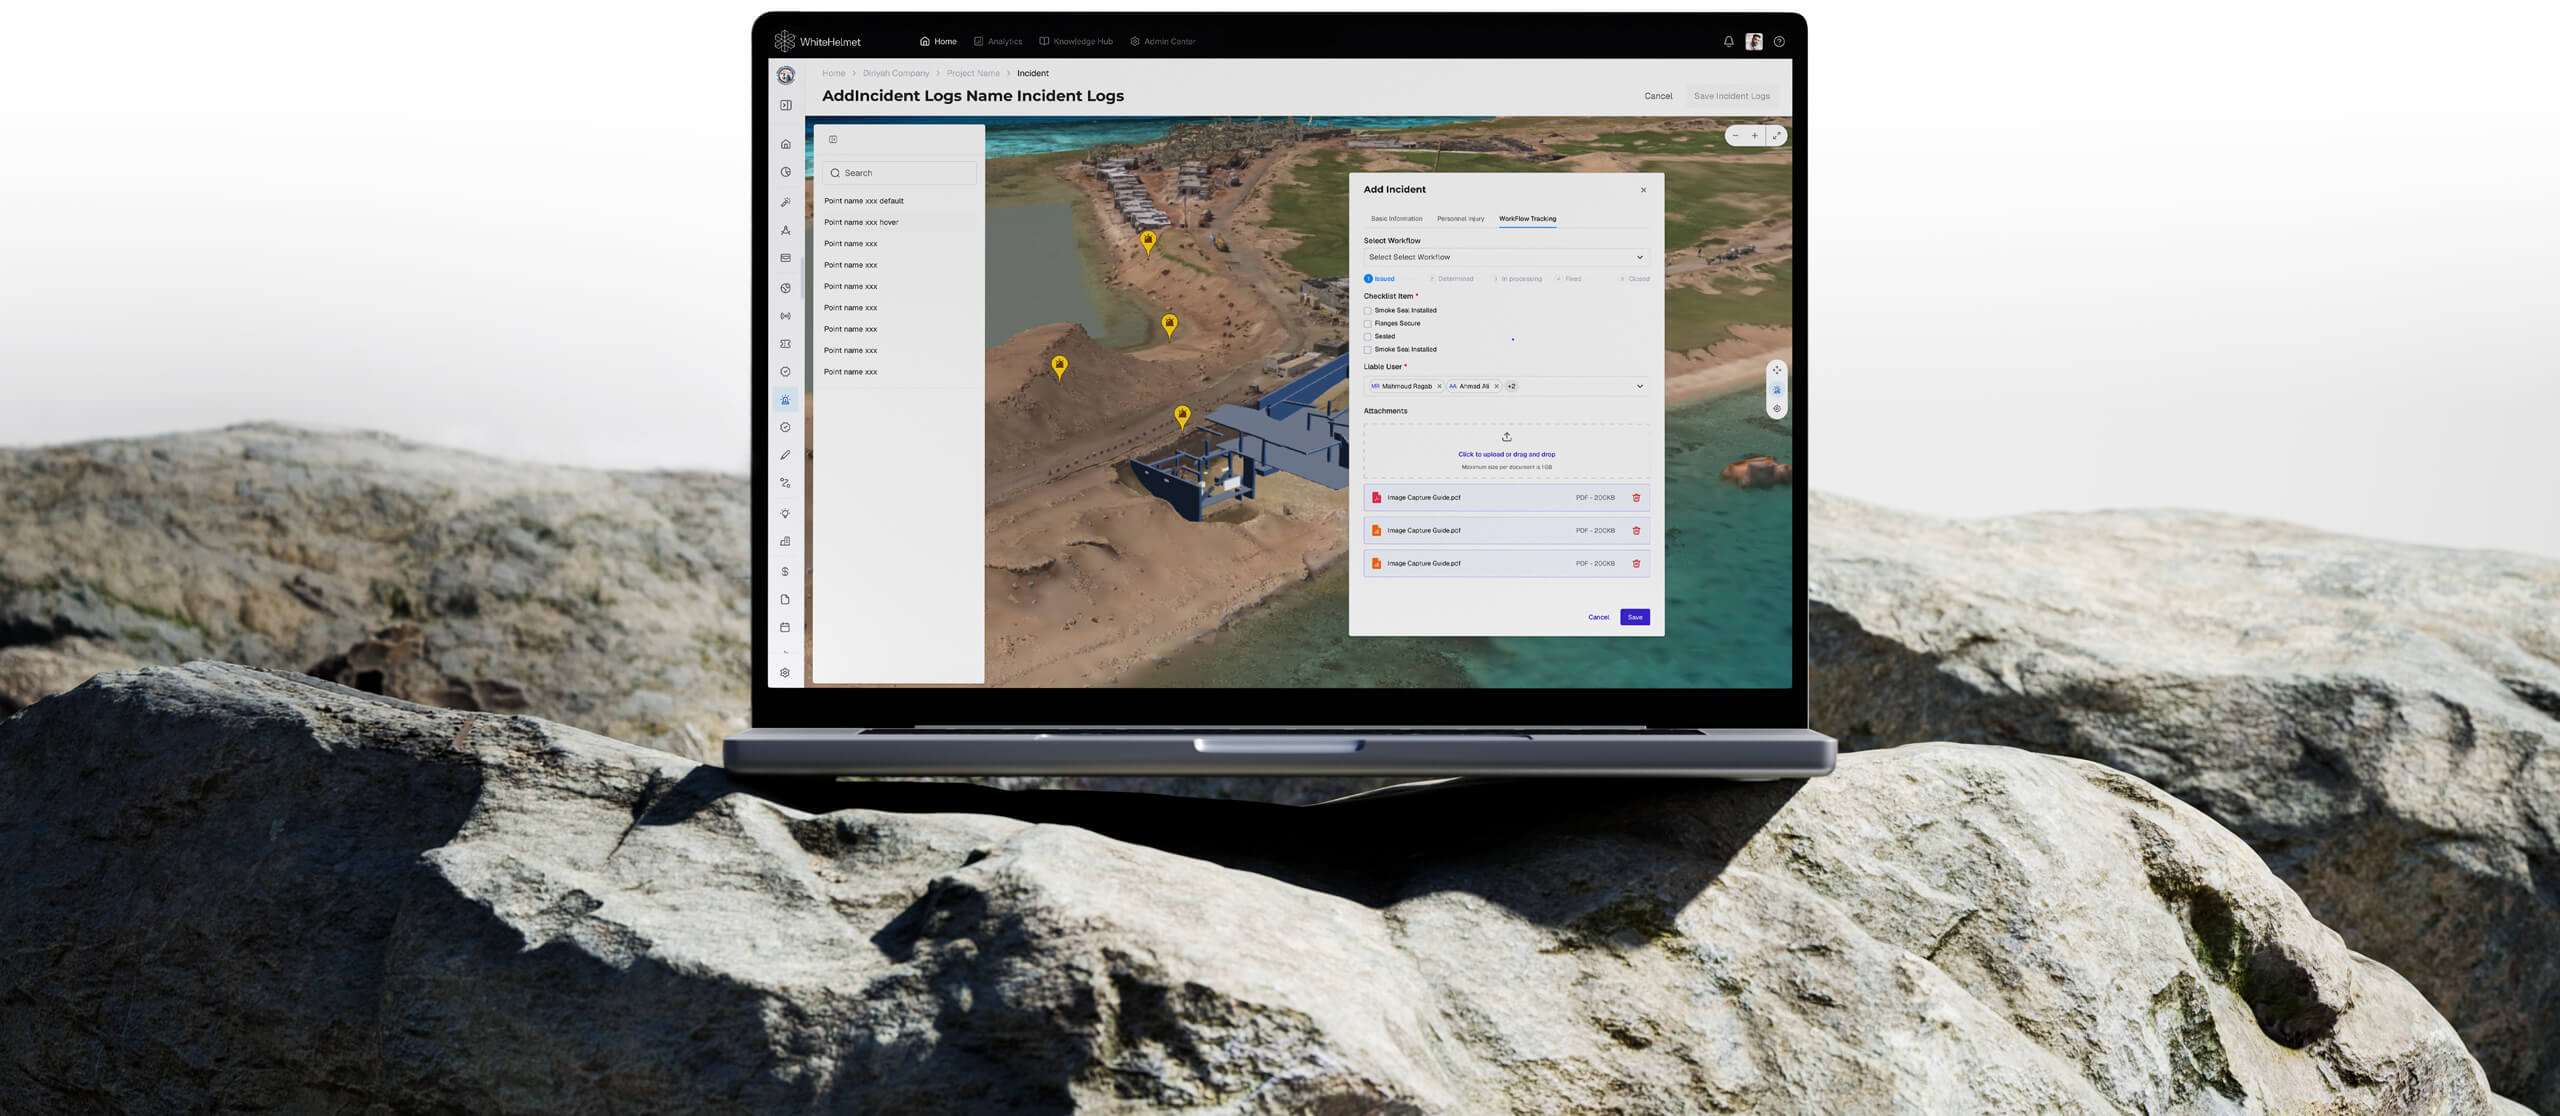
Digitize your entire incident lifecycle — from initial report and geo-tagged documentation through SOP-driven investigation workflows to corrective actions and closure. Incident Management ensures every incident is handled consistently and patterns are identified to take preventive action.
Digital Incident Reporting
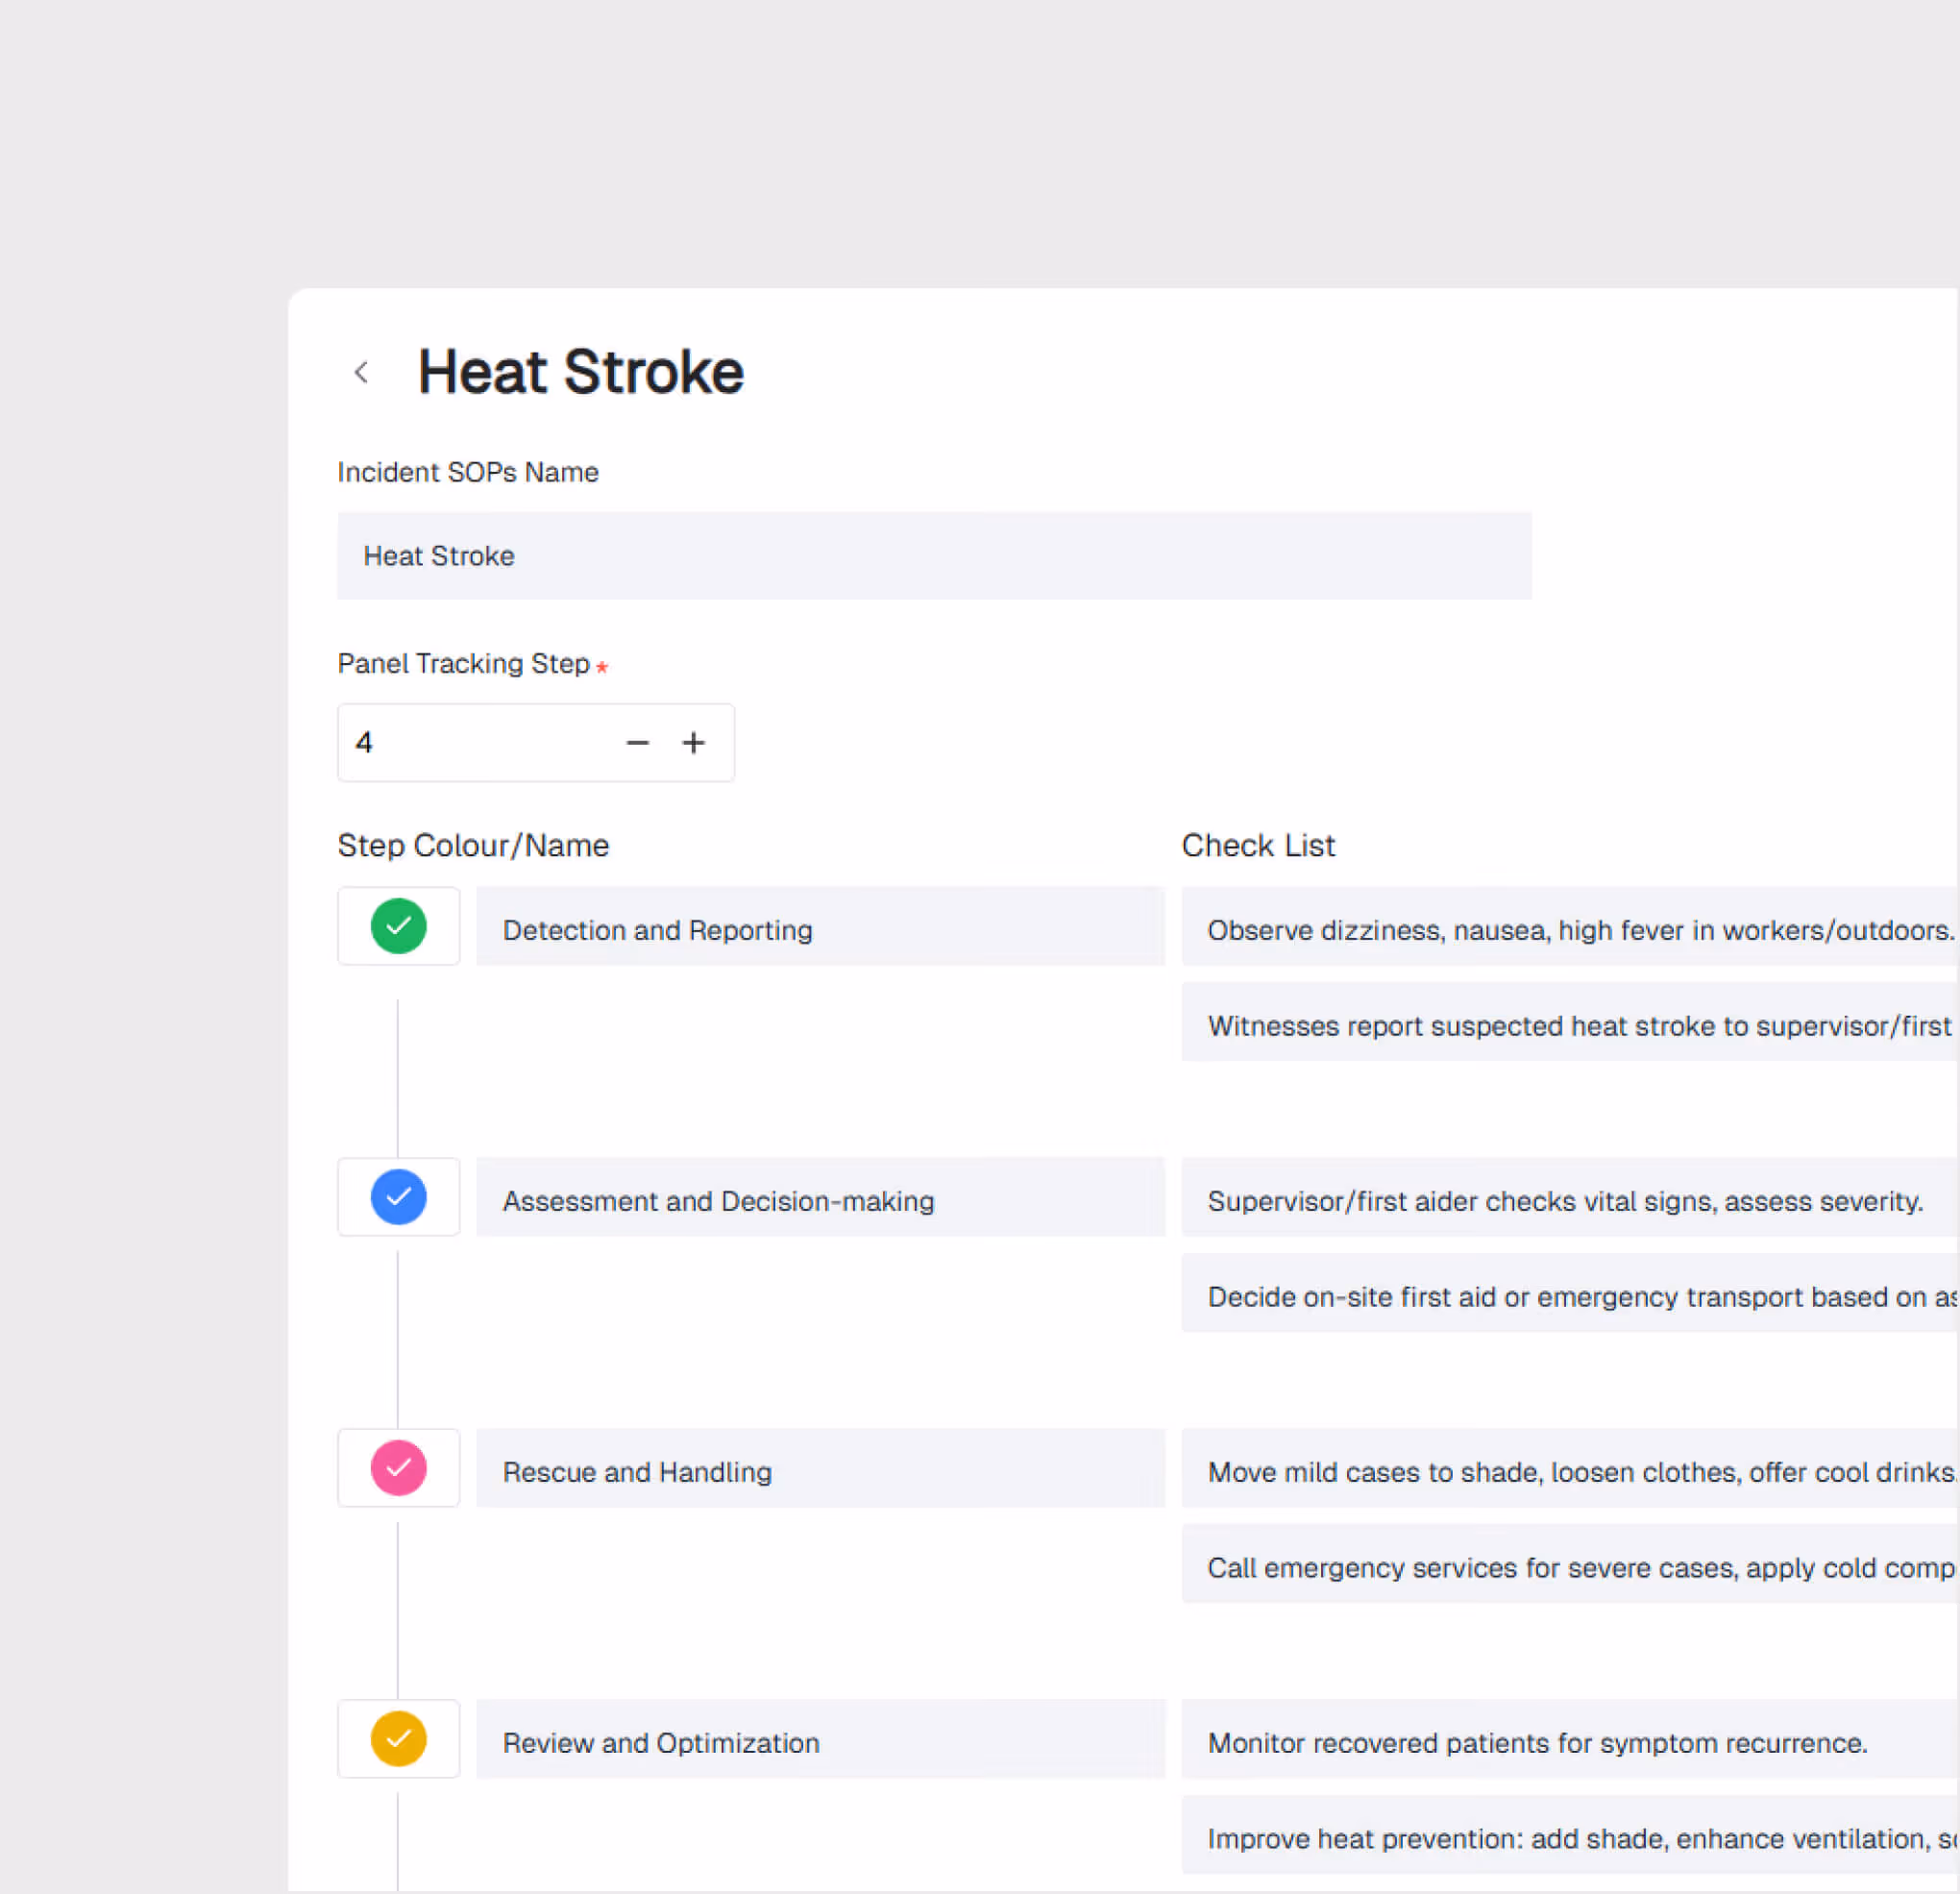
SOP-Driven Investigation Workflows
Geo-Tagged Incident Mapping
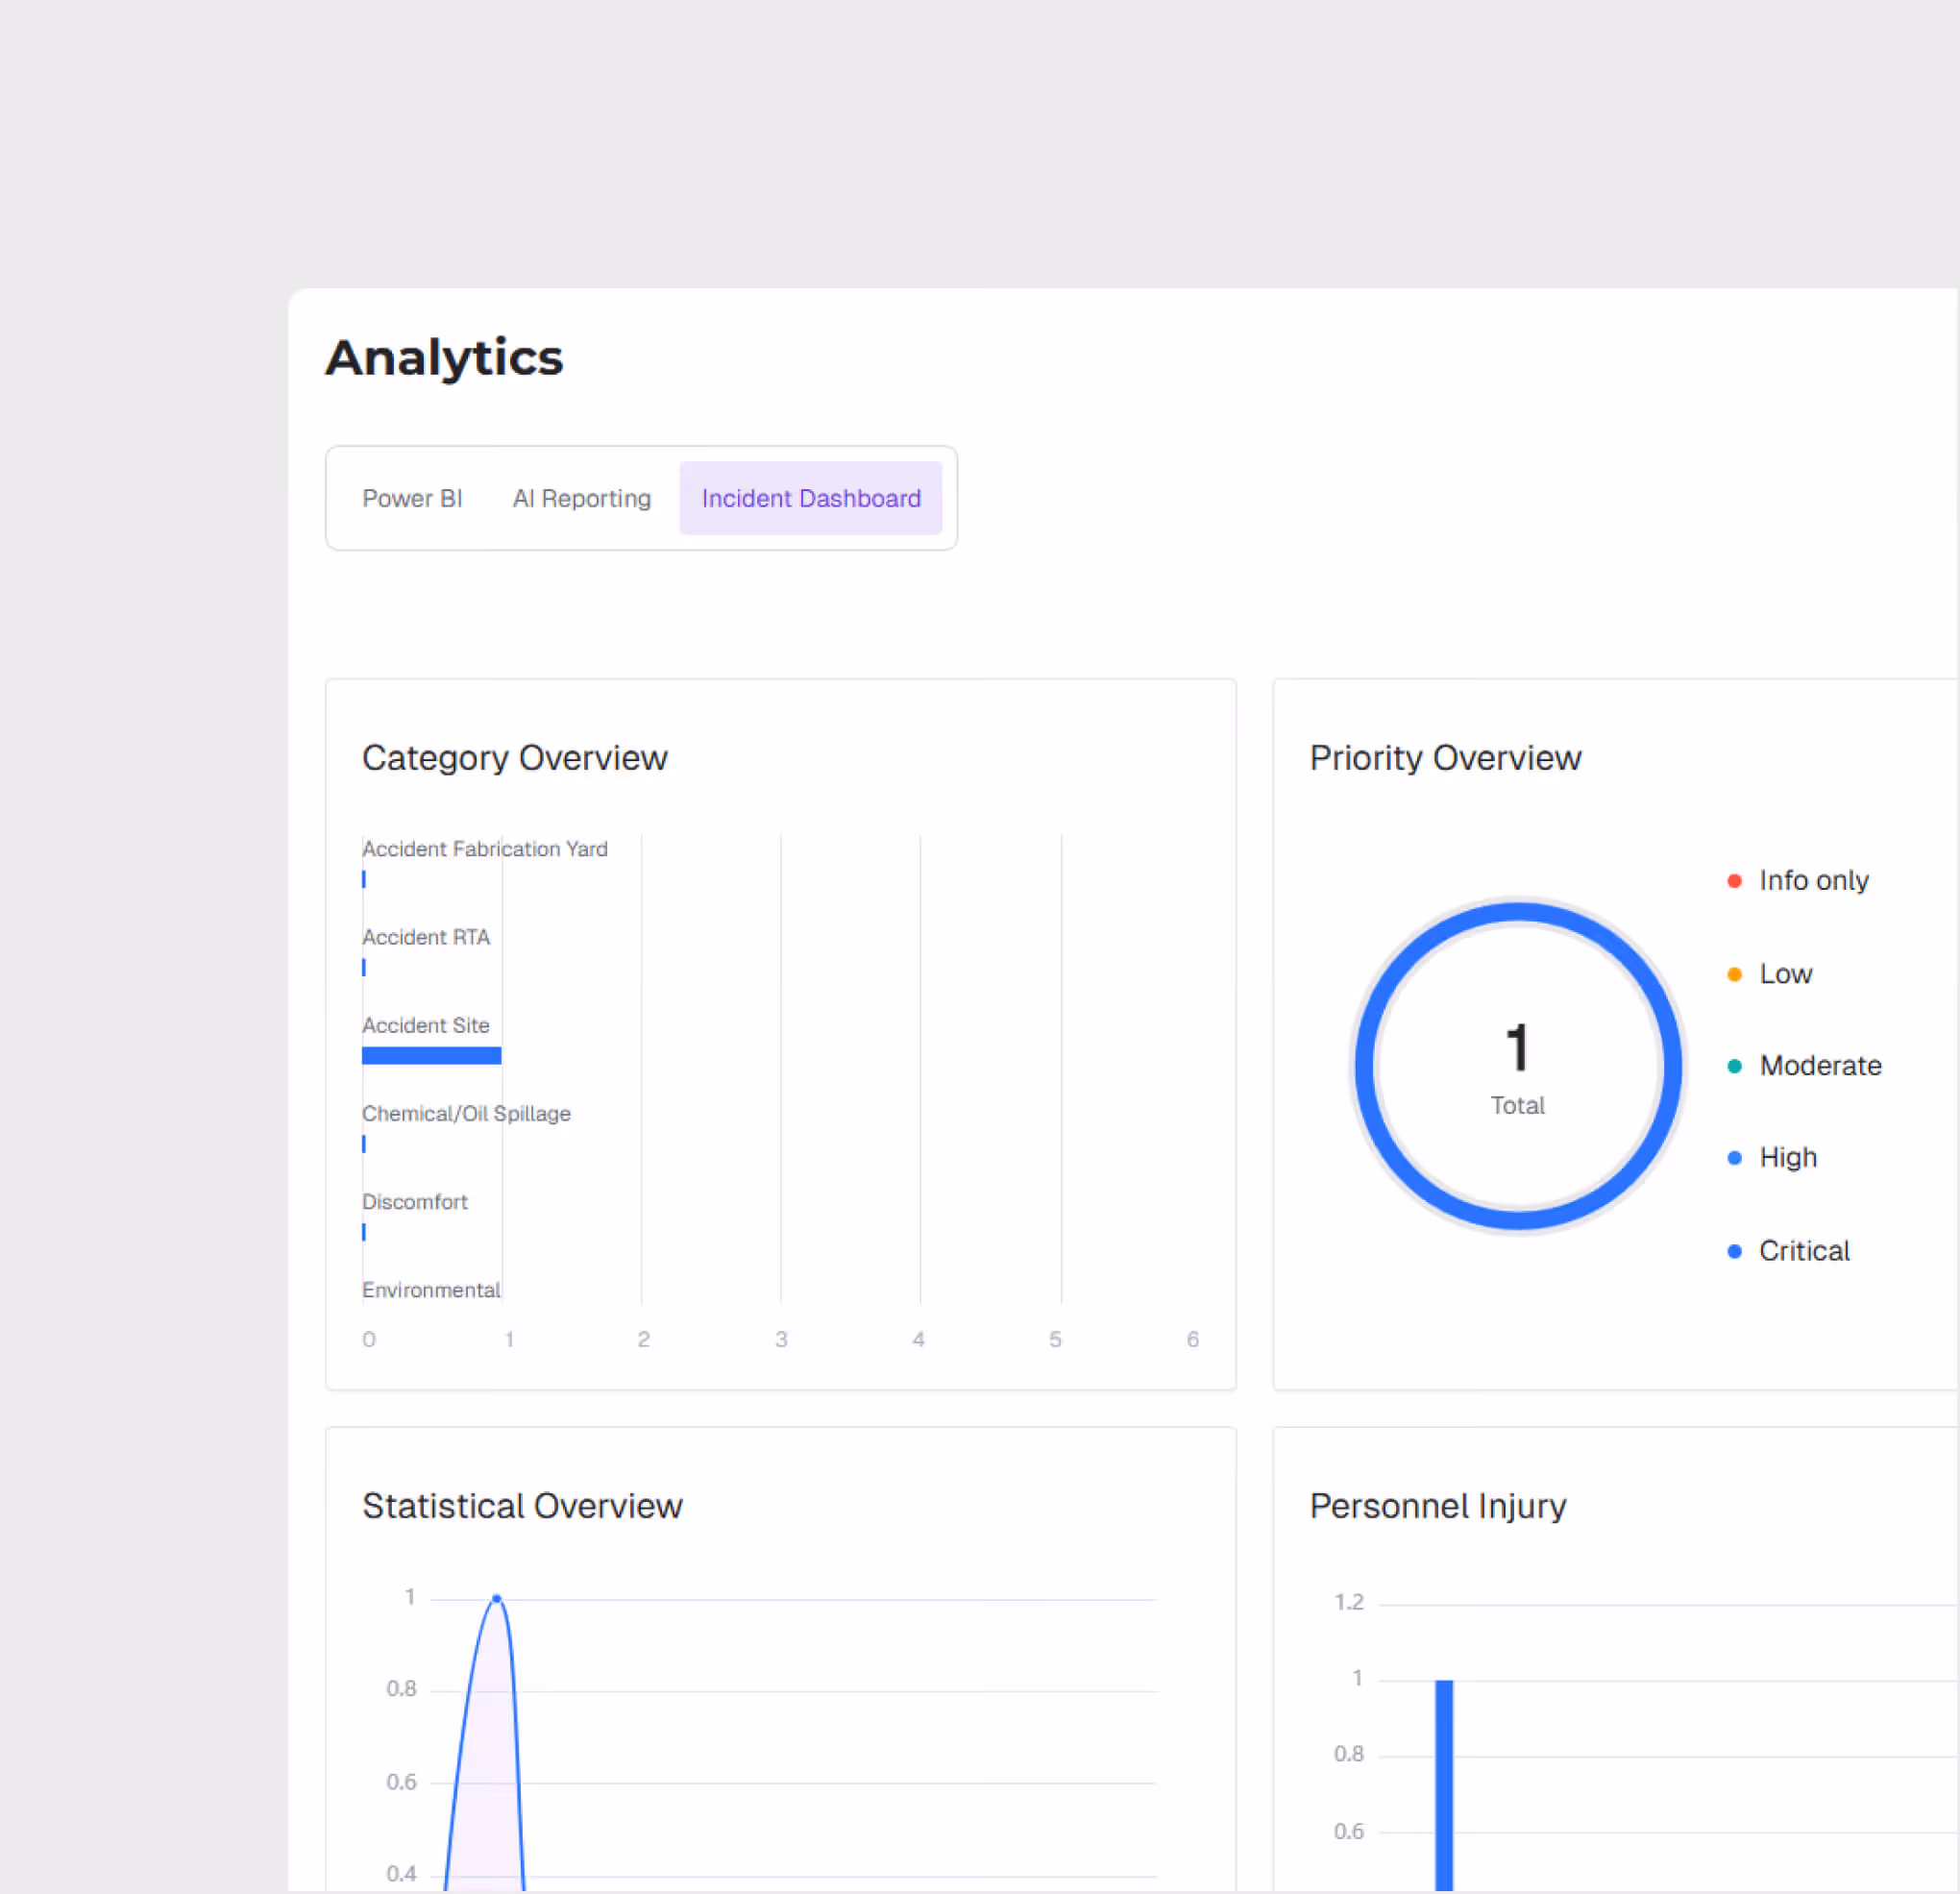
Incident Analytics Dashboard
.avif)
Digital Incident Reporting
Log incidents from the field with structured forms, photo/video evidence, and automatic geo-tagging. Pre-configured templates ensure all required data is captured consistently.
SOP-Driven Investigation Workflow
Trigger standardized investigation workflows automatically based on incident severity. SOPs guide investigators through each step — ensuring consistency and completeness.
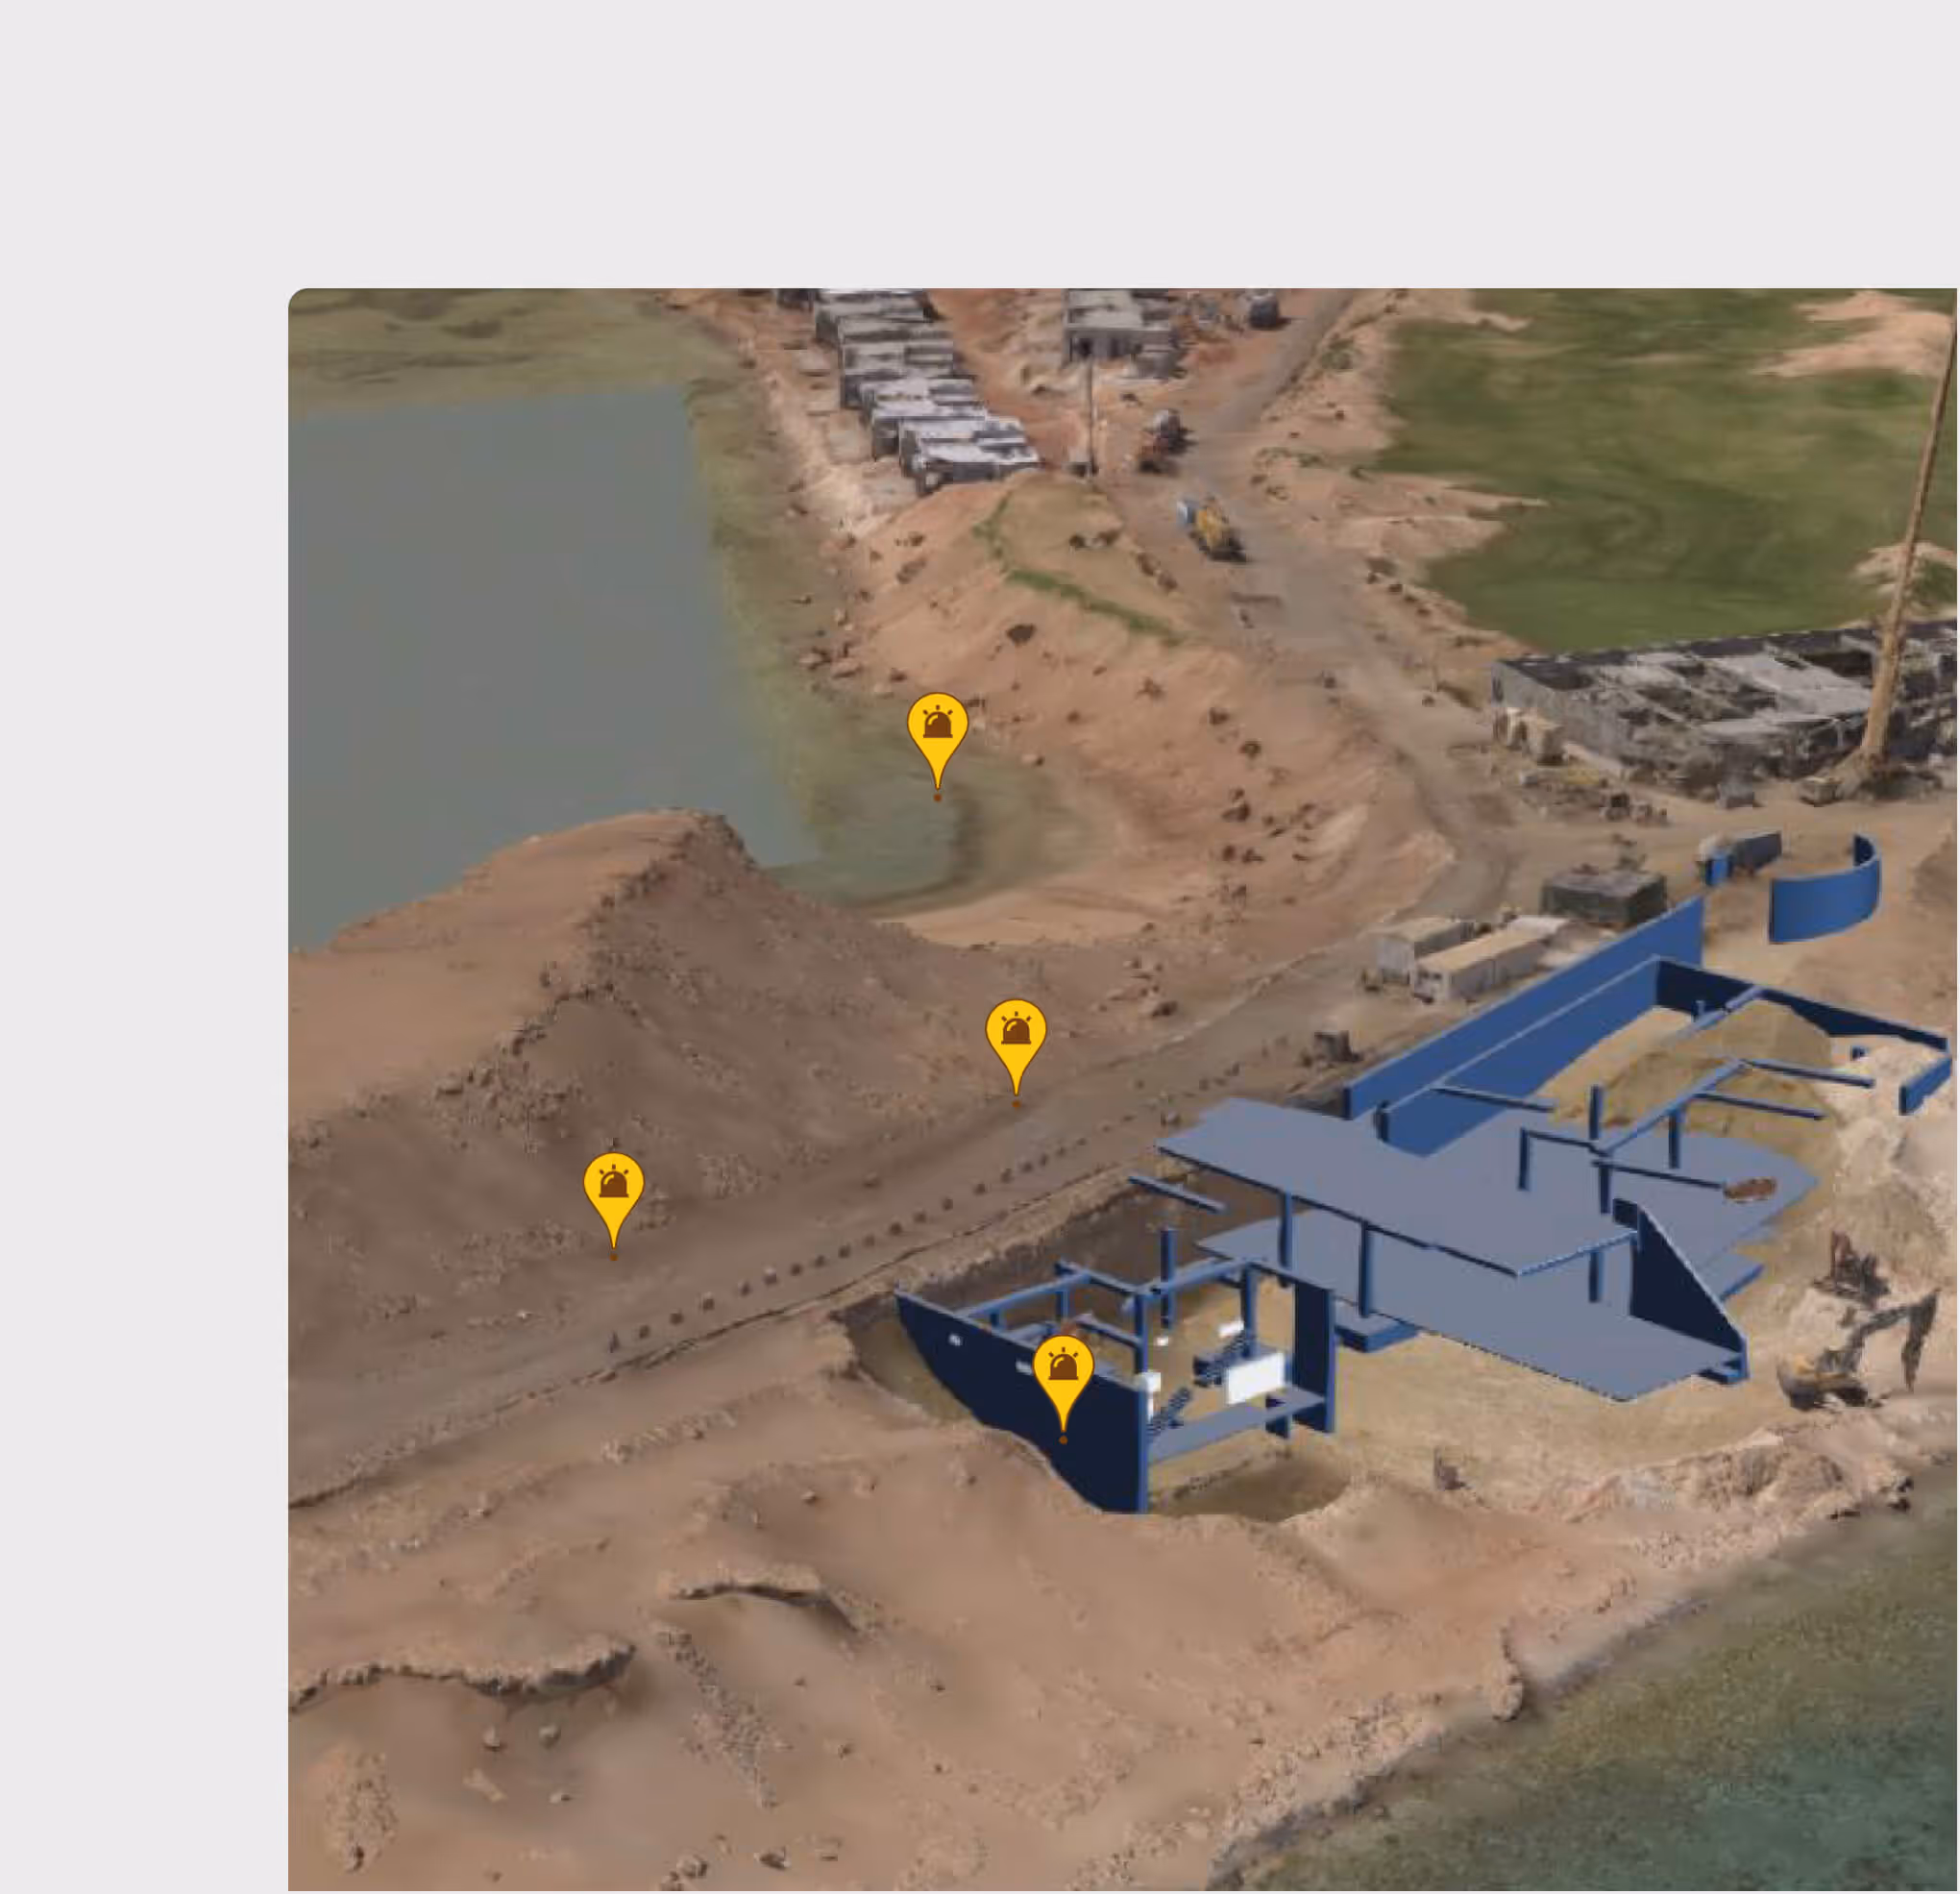
Geo-Tagged Incident Visualization
View all incidents on the project GIS map. Identify spatial patterns, high-risk zones, and recurring incident locations for targeted prevention strategies.
Incident Dashboard & Analytics
Track incident trends, response times, resolution rates, and severity distributions. Generate regulatory reports and identify patterns for proactive safety management.
Incident Management is most useful for:
HSE Managers
Incident Lifecycle Oversight
Manage the full incident lifecycle from report to closure, ensure SOP compliance for investigations, and track corrective action completion.
Site Supervisors
Rapid Incident Reporting
Report incidents in the field immediately using mobile forms with geo-tagging and photo evidence — eliminating delayed paper-based reporting.
QHSE Directors
Trend Analysis & Prevention
Analyze incident patterns across the project portfolio, identify systemic risks, and implement preventive measures based on data — not intuition.
"Previously all our incidents were called in across site with no visibility in patterns and areas to improve. With WhiteHelmet Incident Management, we quickly identified the largest areas of improvement and were able to attain an accurate report of incidents per month."
.avif)
Frequently asked questions
A stable 4G/LTE or Wi-Fi connection is sufficient for live video streaming. The platform adapts video quality to available bandwidth.
Any 360 camera-equipped device can stream live video. No special hardware is required beyond a stable internet connection.
The dashboard tracks incident frequency, severity trends, response times, resolution rates, and corrective action completion — with drill-down capability by zone, type, and time period.
Multiple stakeholders can join a single session simultaneously from different locations, enabling group site tours and collaborative decision-making.
Yes. Overlay point cloud scans or drone imagery against BIM models to visualize progress. The system highlights variances and quantifies differences.
Upload drone images or orthomosaics, and the AI automatically detects construction progress, calculates earthwork volumes, and identifies site conditions — no manual processing required.
WhiteHelmet products Incident Management works well with

Field Intelligence
