
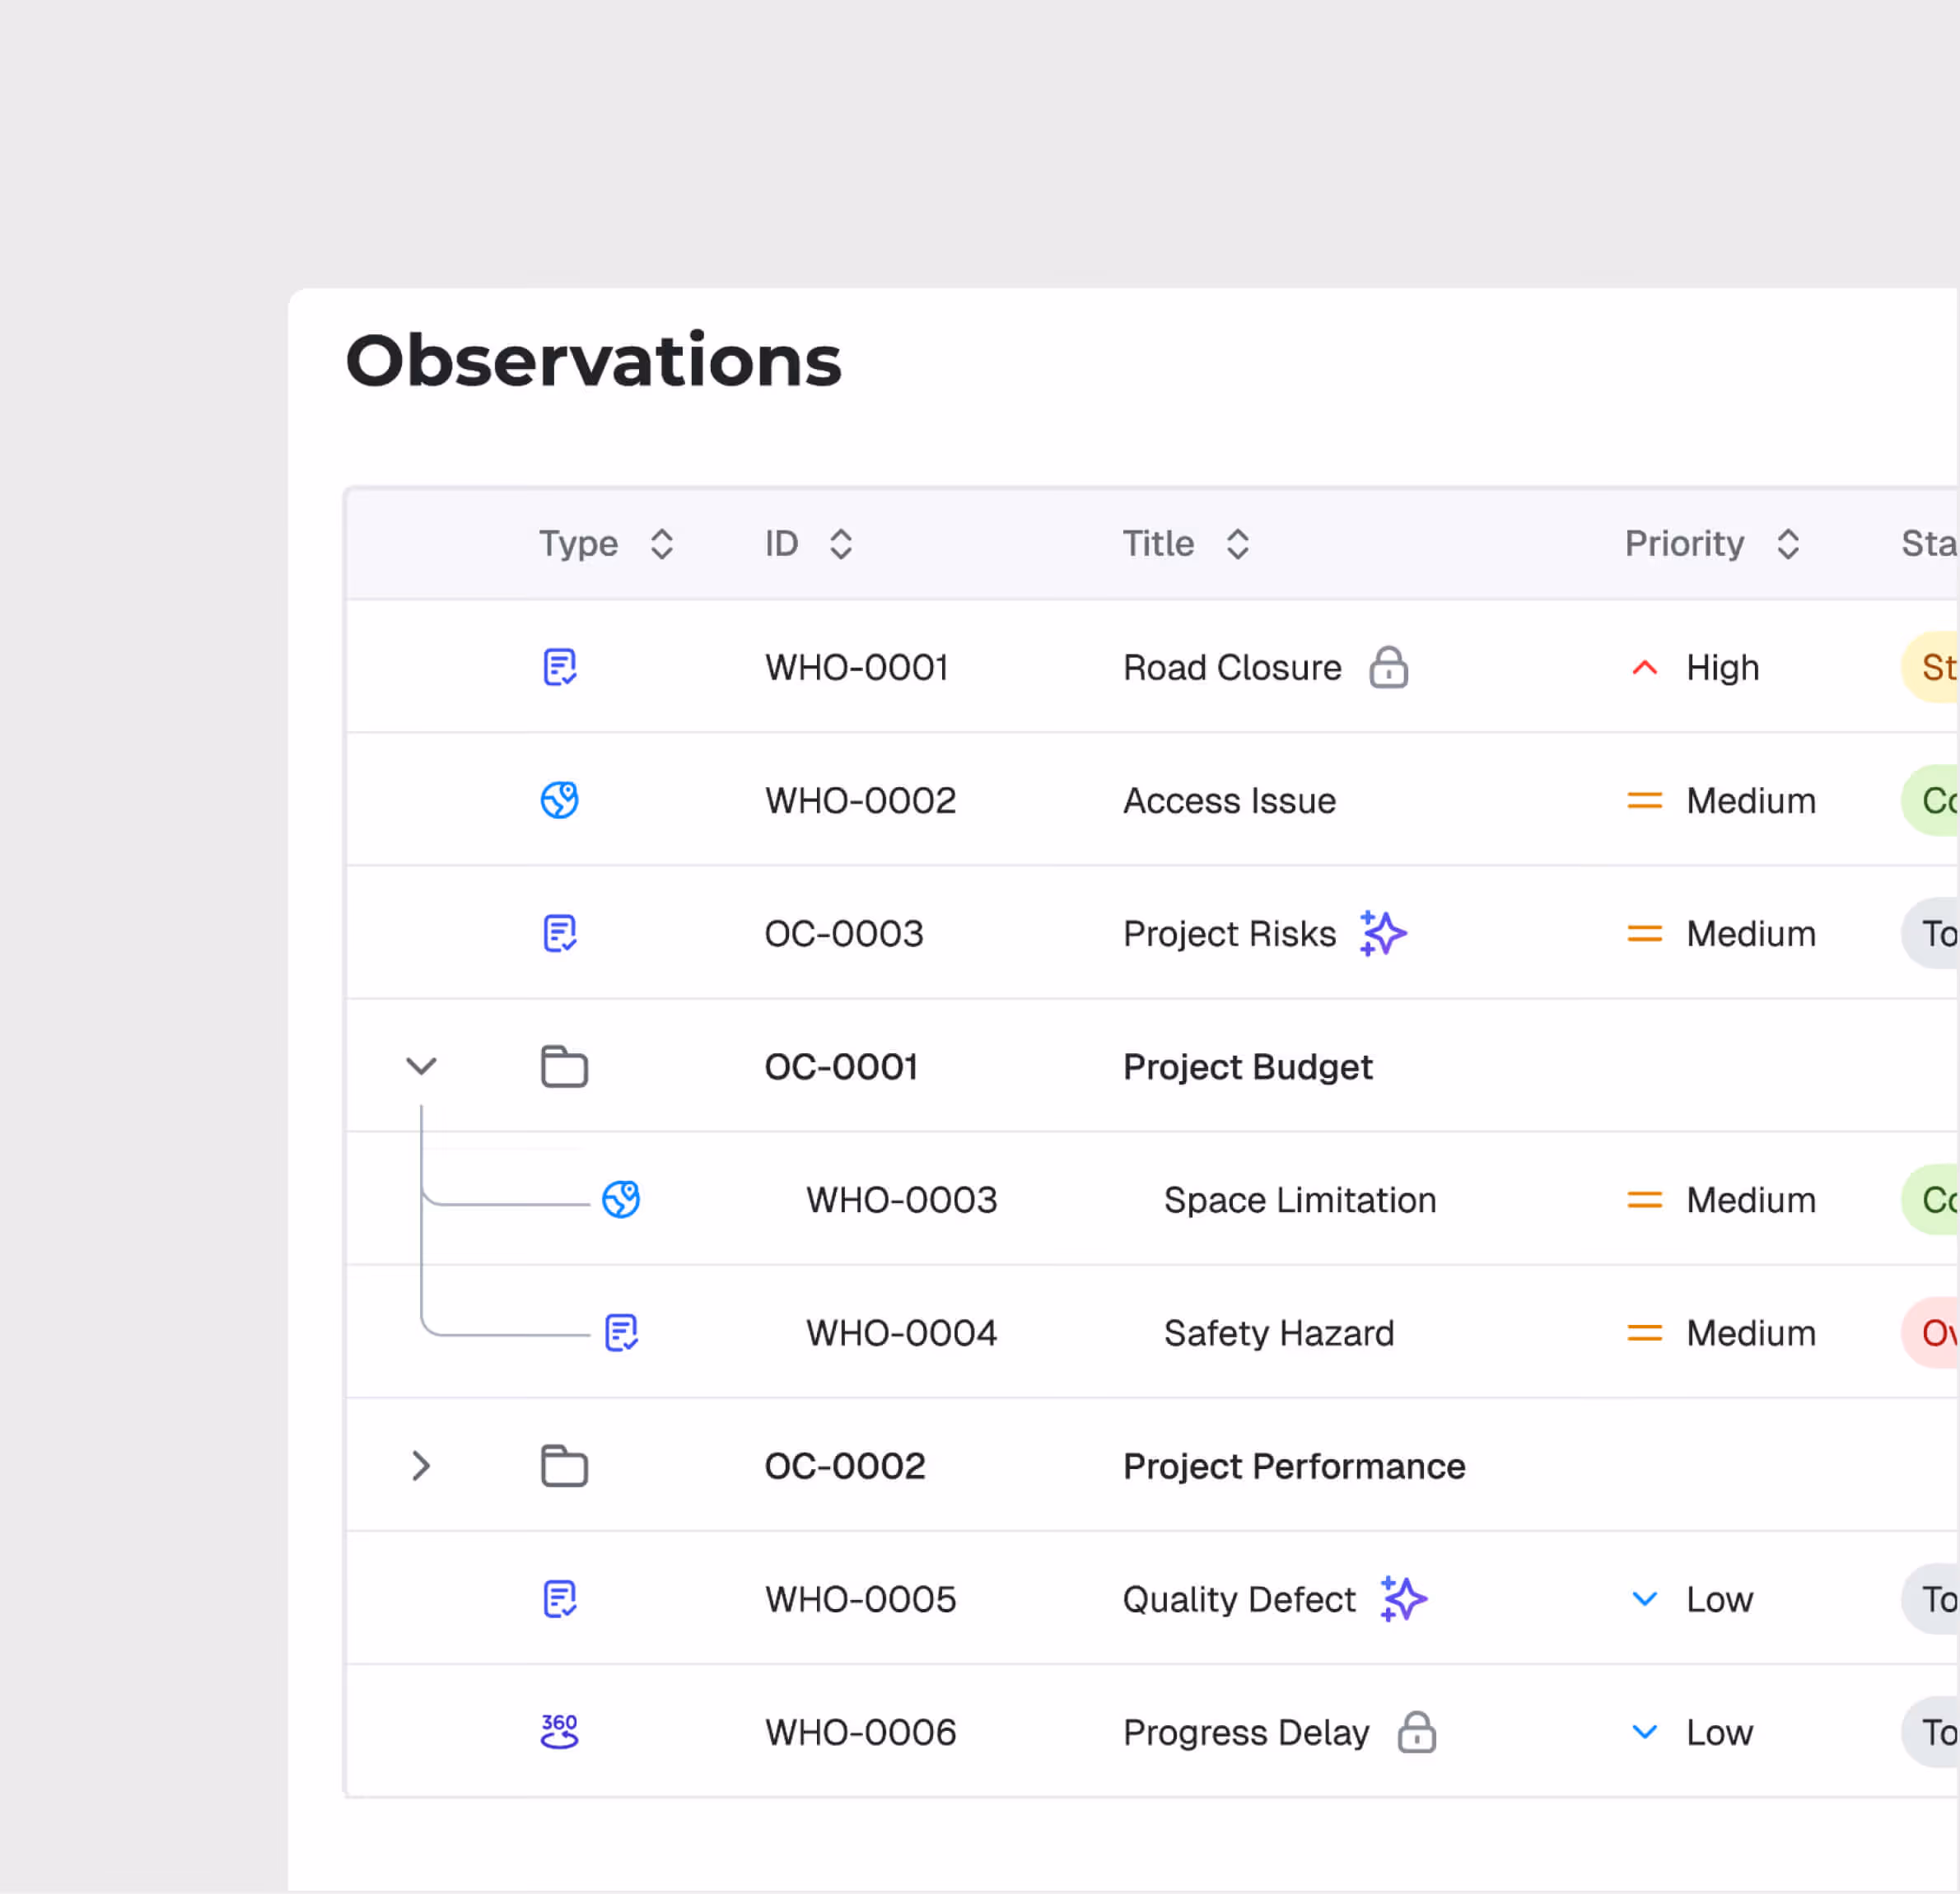
Observations
Geo-tagged site observation management with auto-escalation and resolution tracking.
Spot It. Log It. Resolve It. Faster.
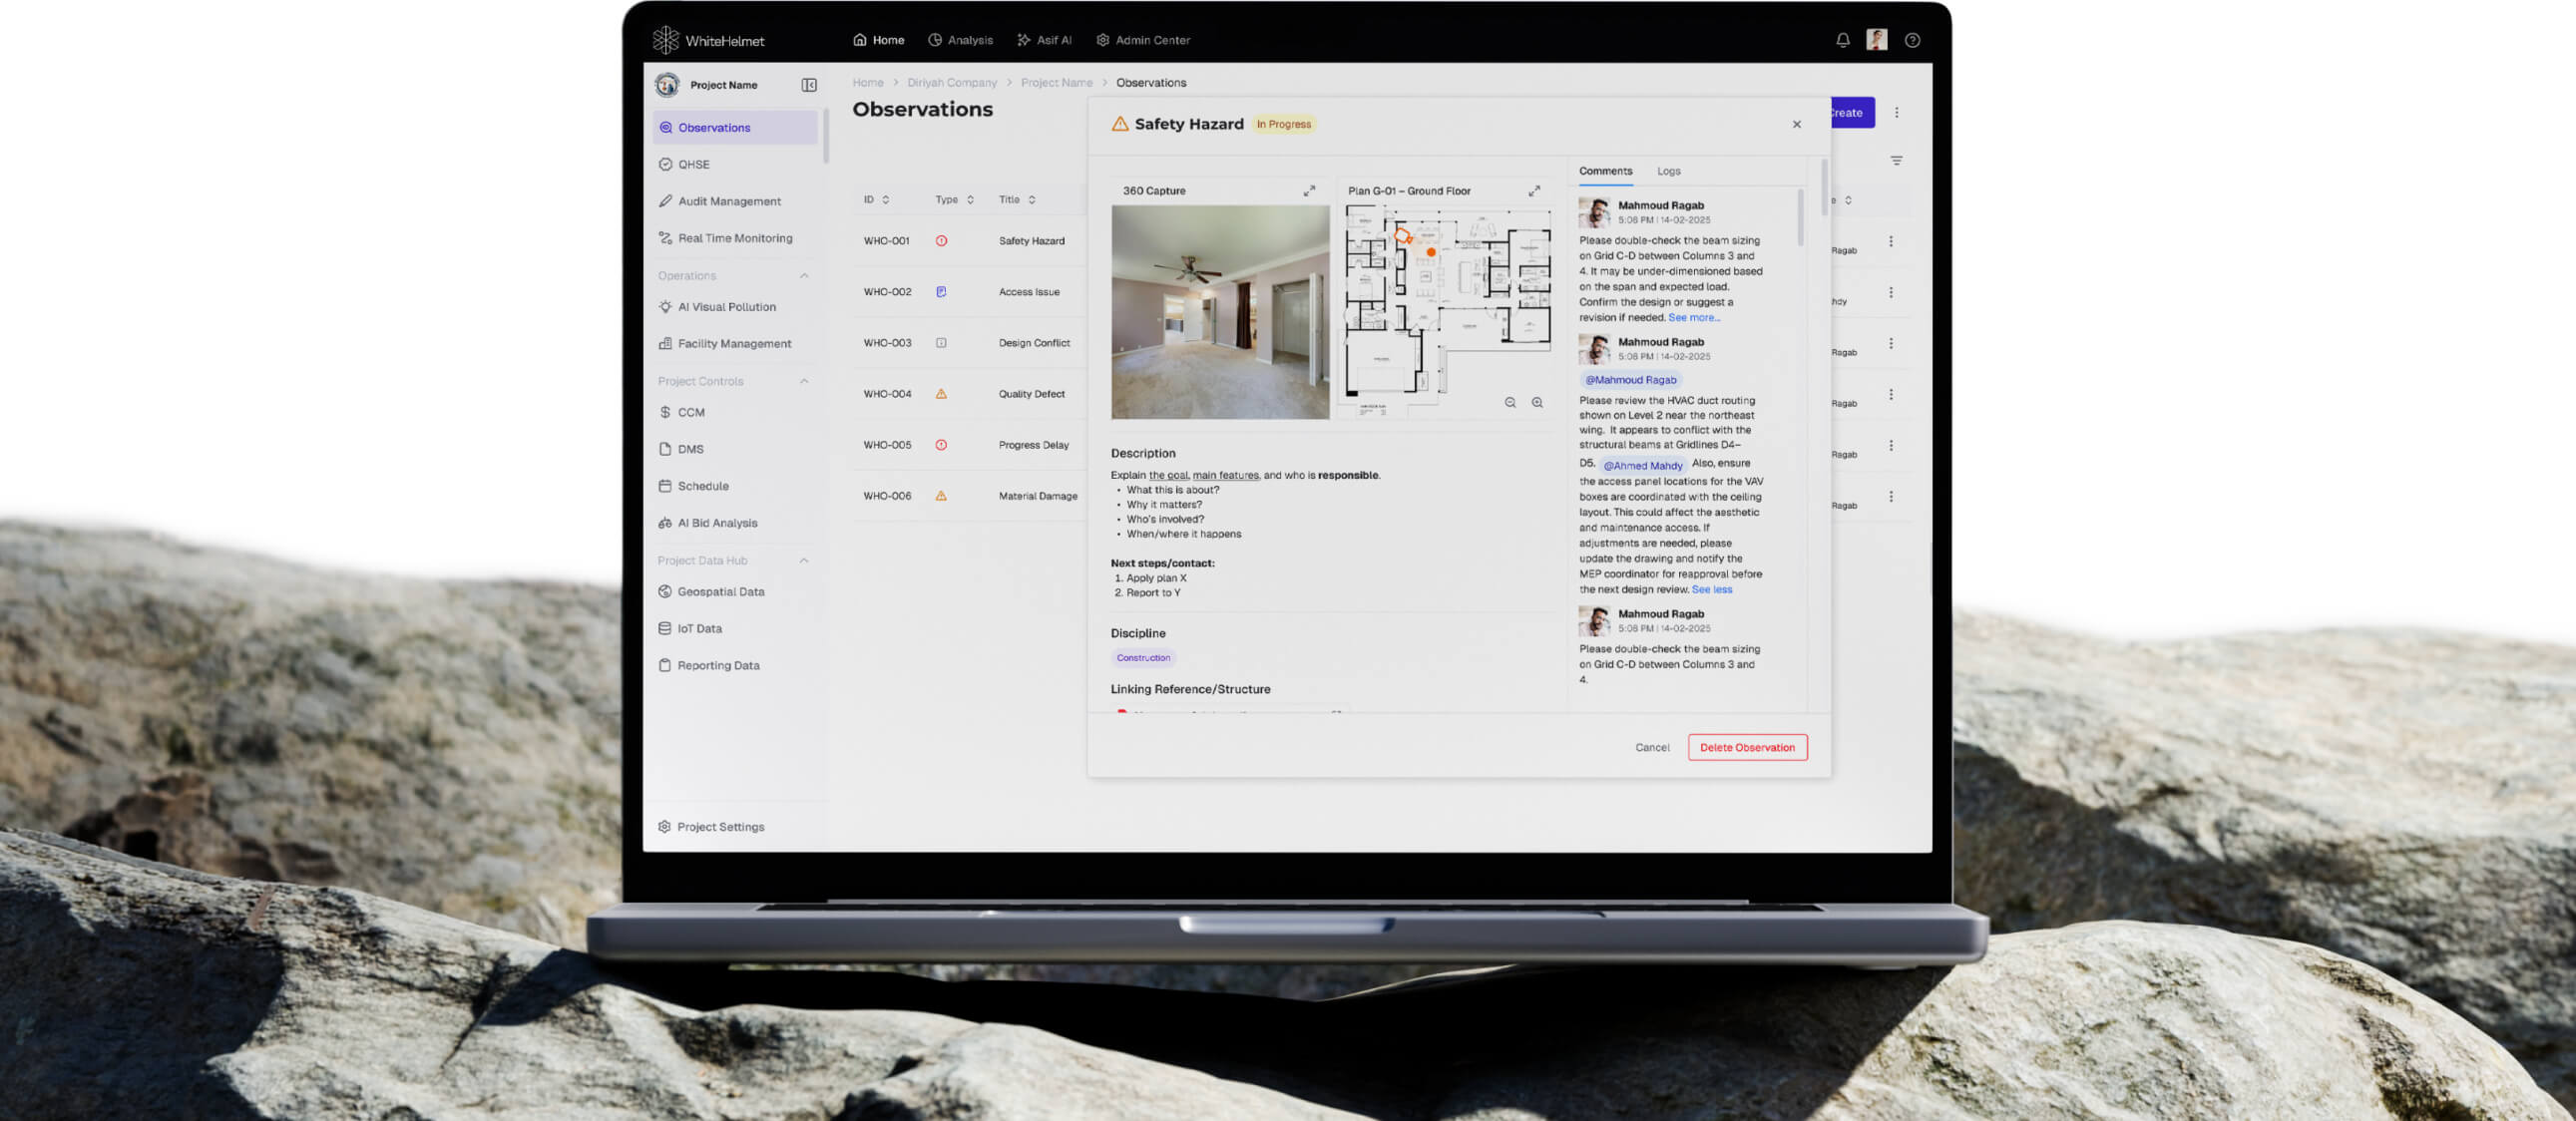
Log site observations with location data, photos, and categories. Track each observation through assignment, resolution, and closure — with auto-escalation to ensure nothing falls through the cracks. Resolves snags and create punch lists during closeout.
Geo-Tagged Observation Logging
Tag and Comment to Colleagues
Resolution Tracking Dashboard
Multi-Category Classification
Photo & Evidence Attachment
Geo-Referenced Observation Logging
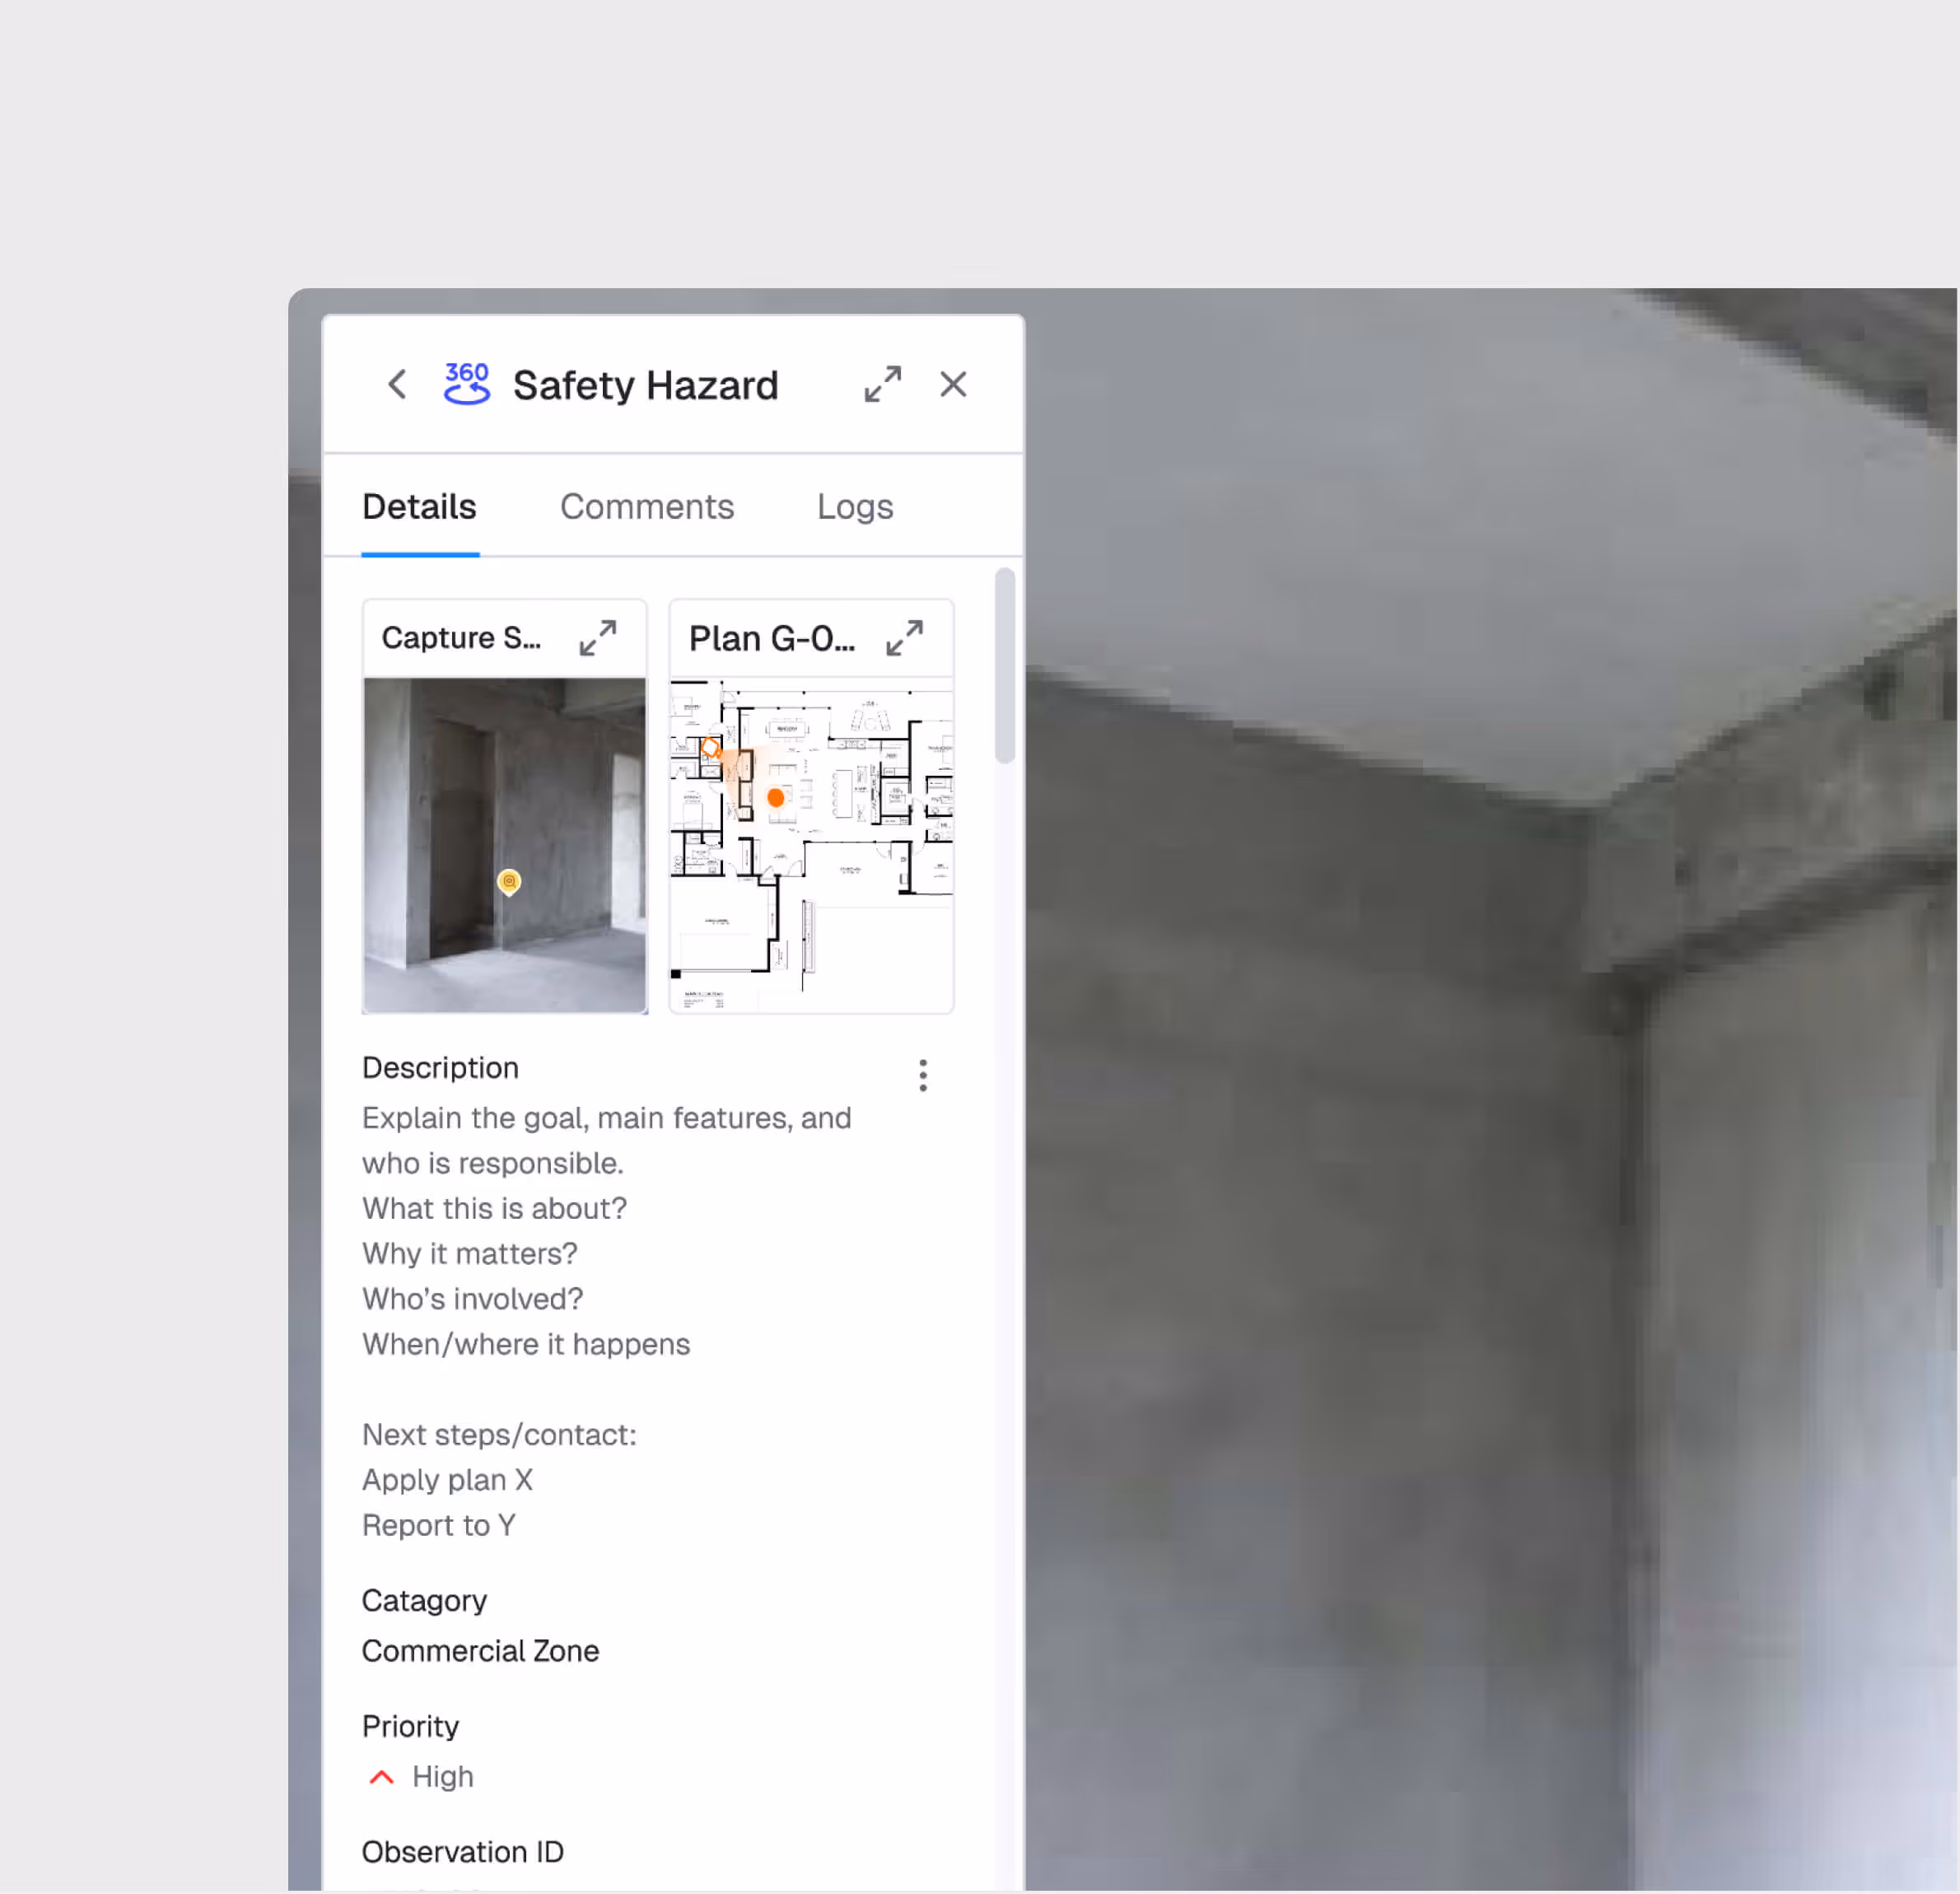
Log observations from the field with automatic geo-tagging, photos, and structured categories. Every observation is anchored to a specific location on the project map.
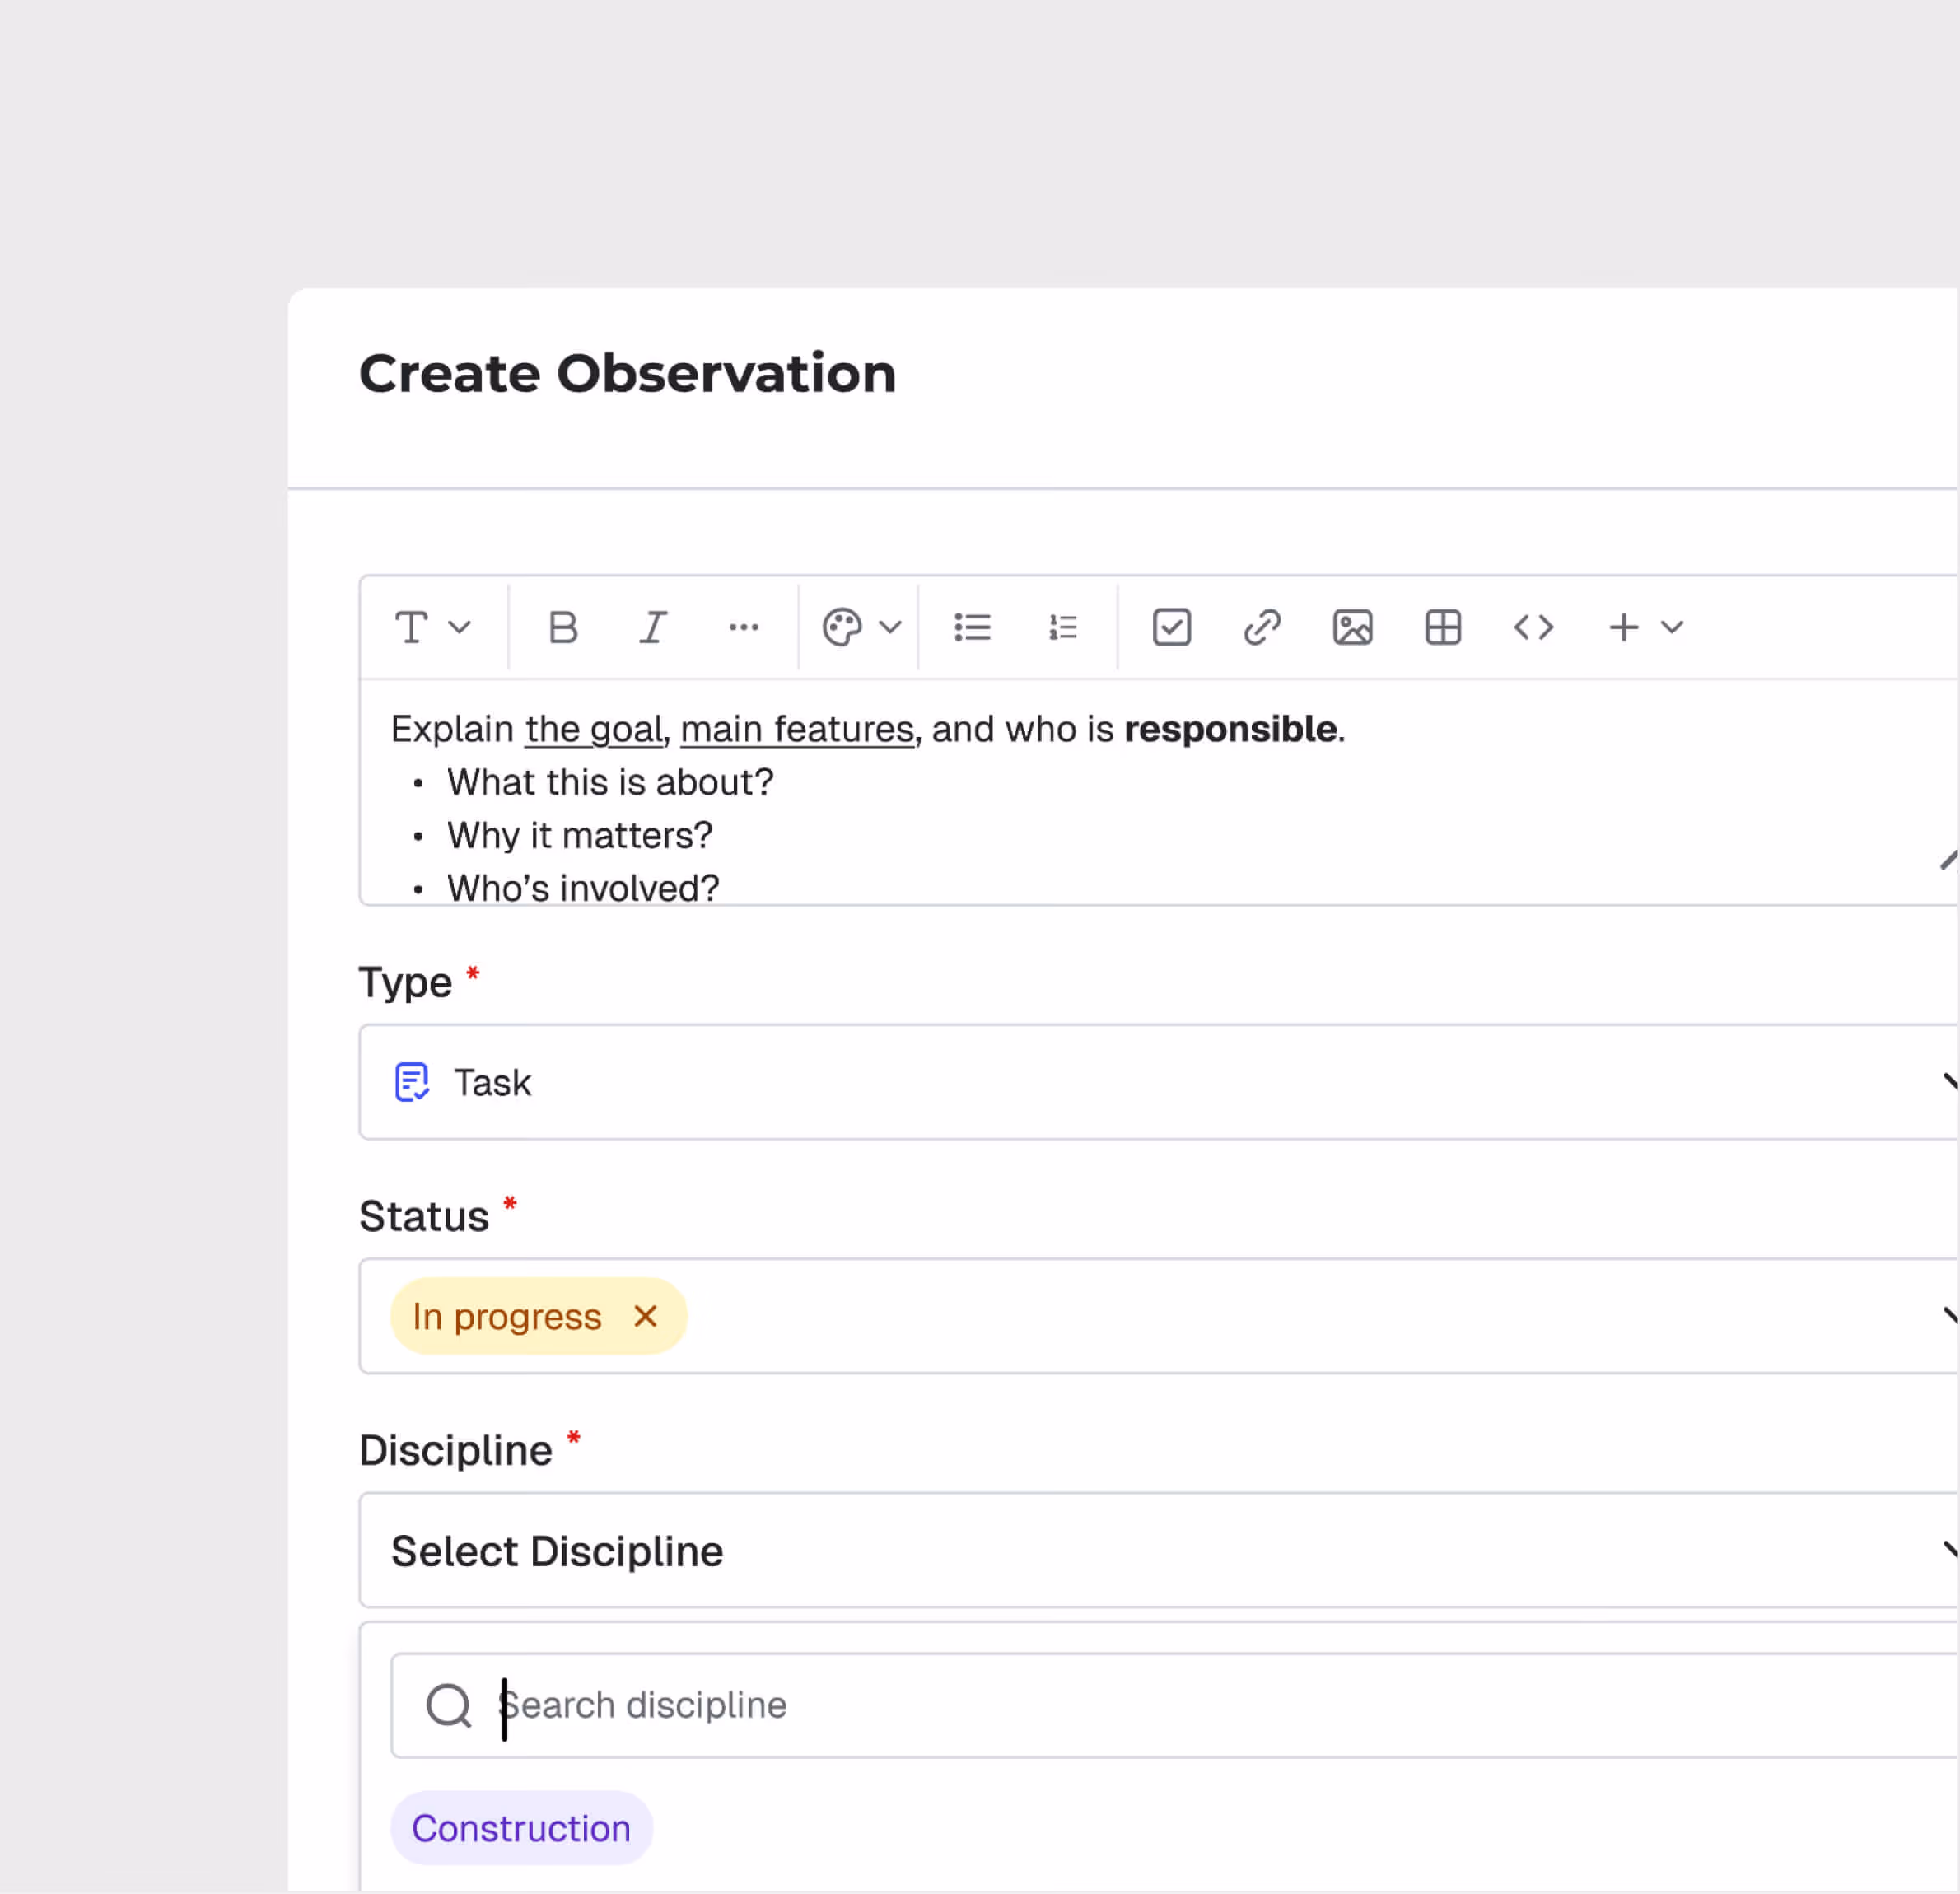
Categorize Observations
Select observation categories and severity levels based on the description and photos, ensuring consistent classification across your team.
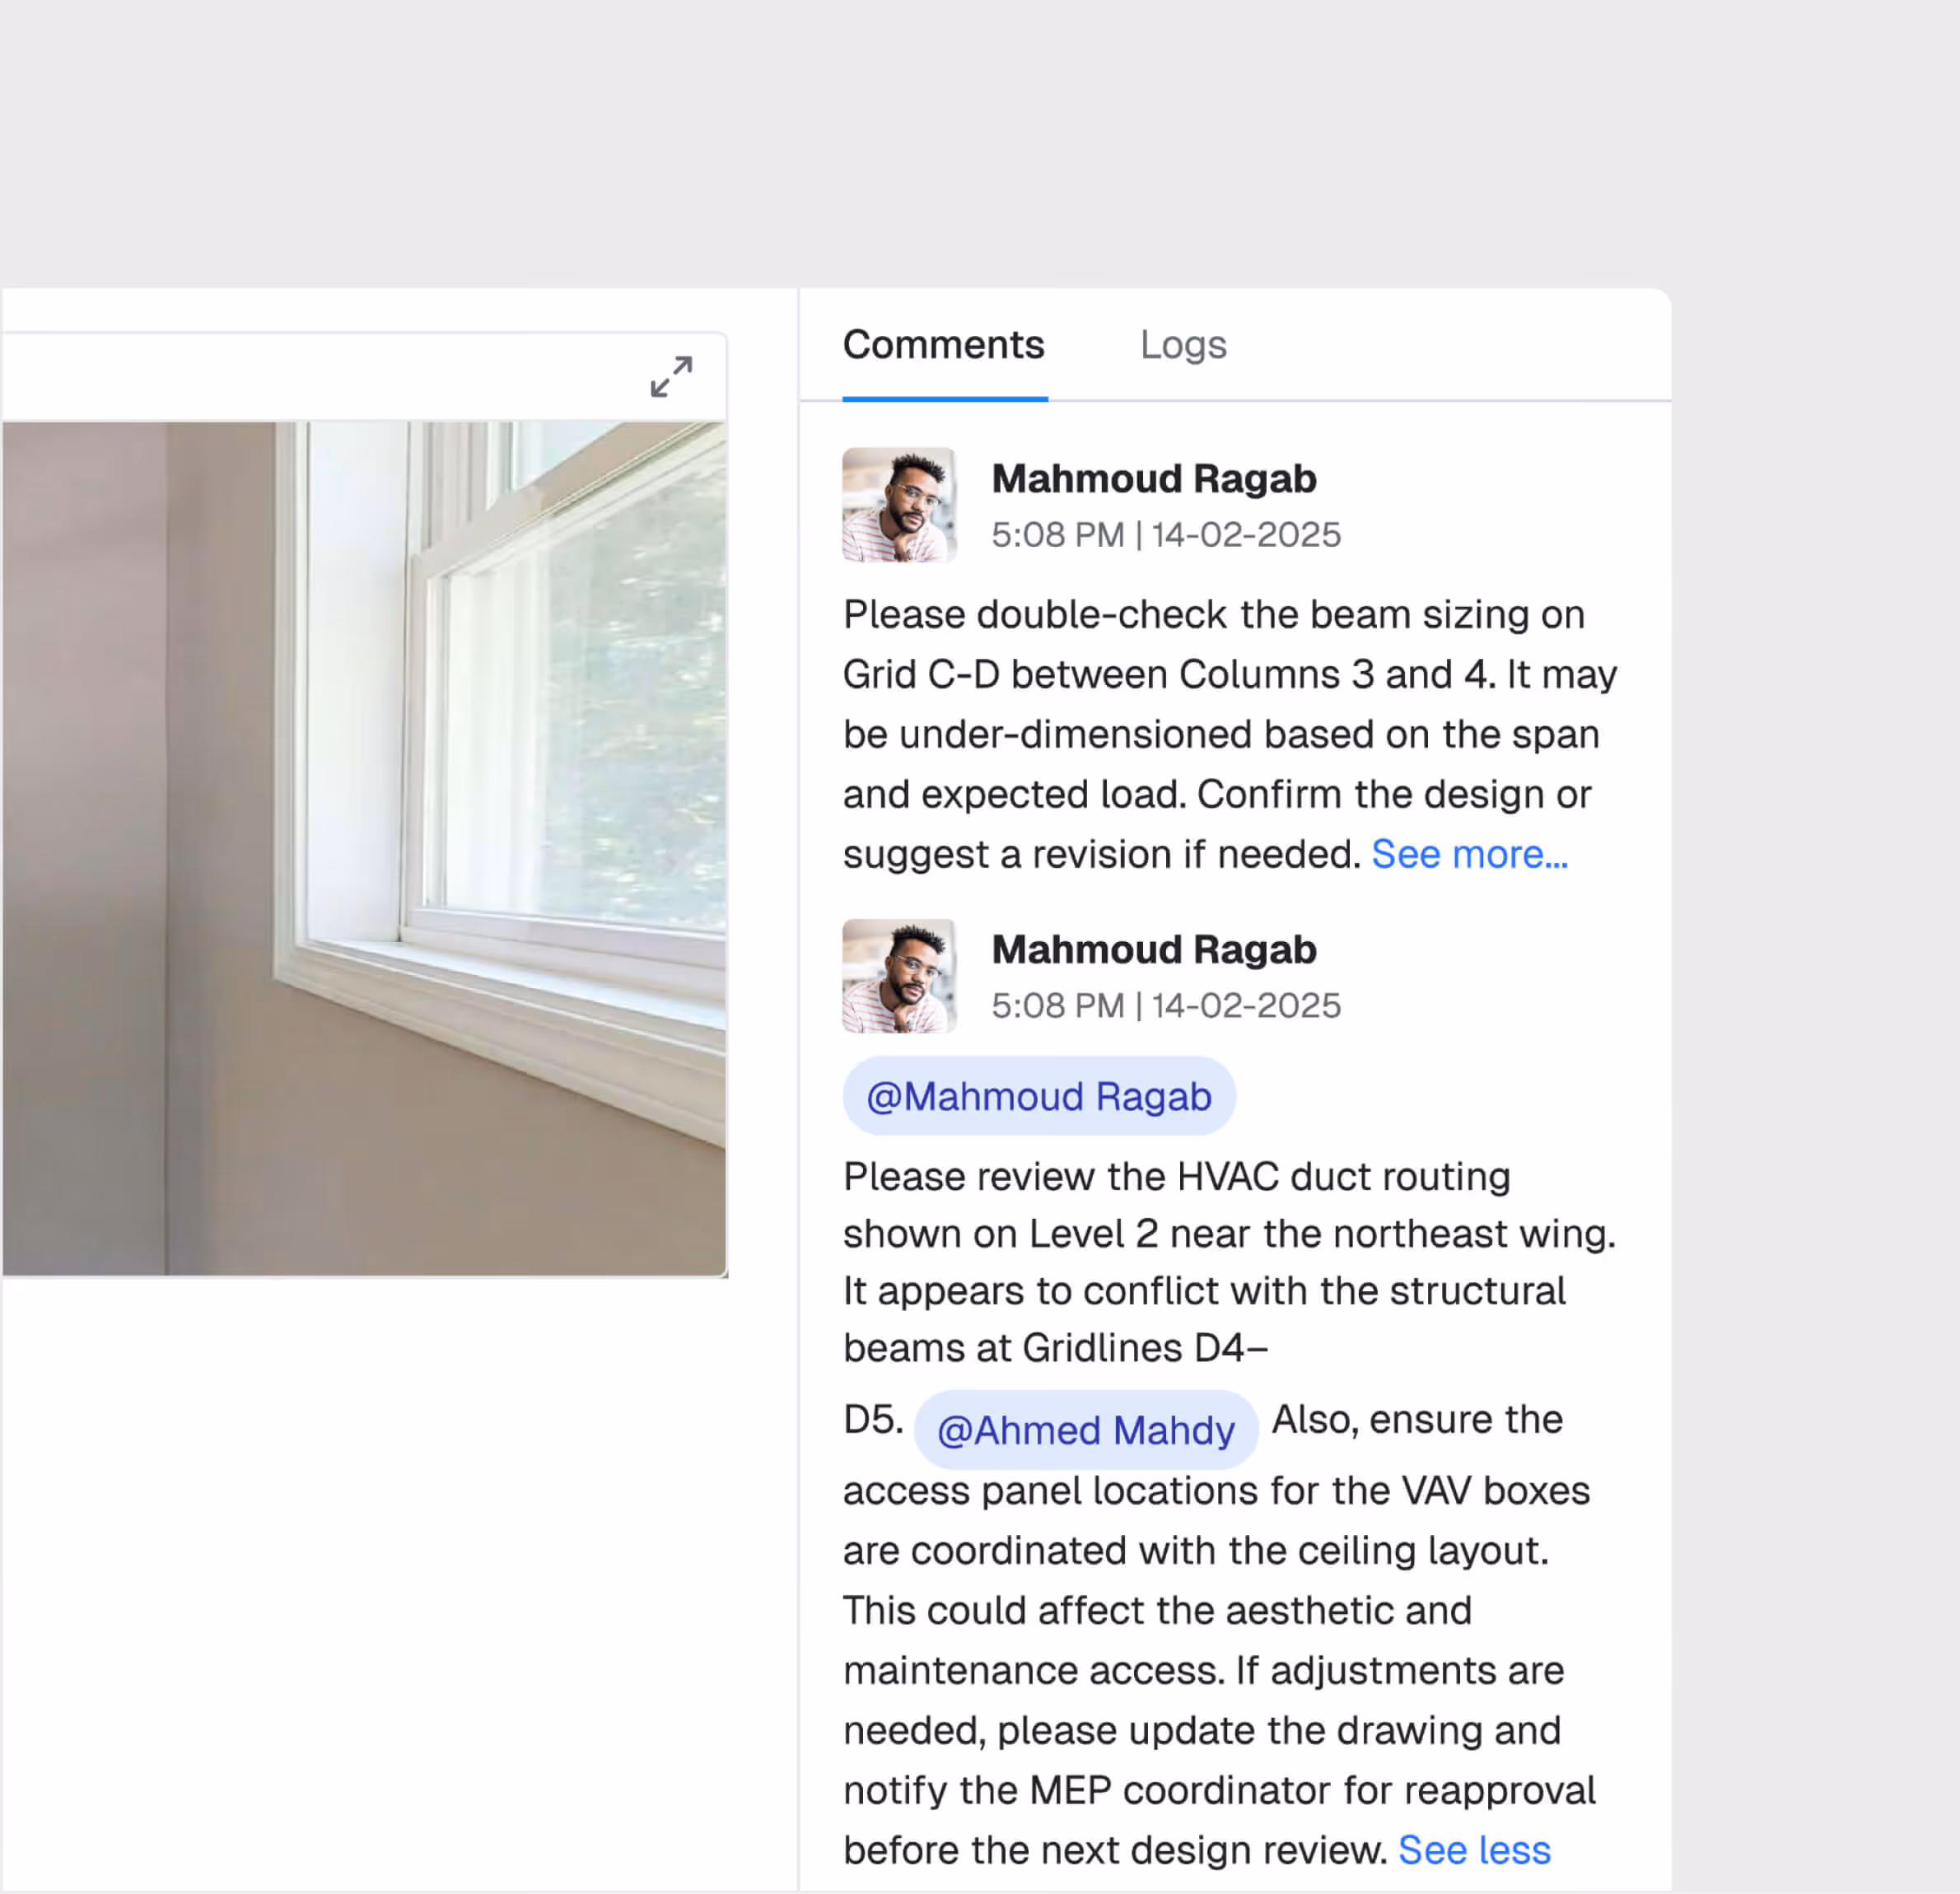
Tag and Comment Colleagues
Comment on observations, tag colleagues, and assign relevant person to resolve the issue.
Resolution Tracking Dashboard
Track all observations through their lifecycle — open, assigned, in-progress, resolved, closed — with real-time dashboards showing response times and resolution rates.
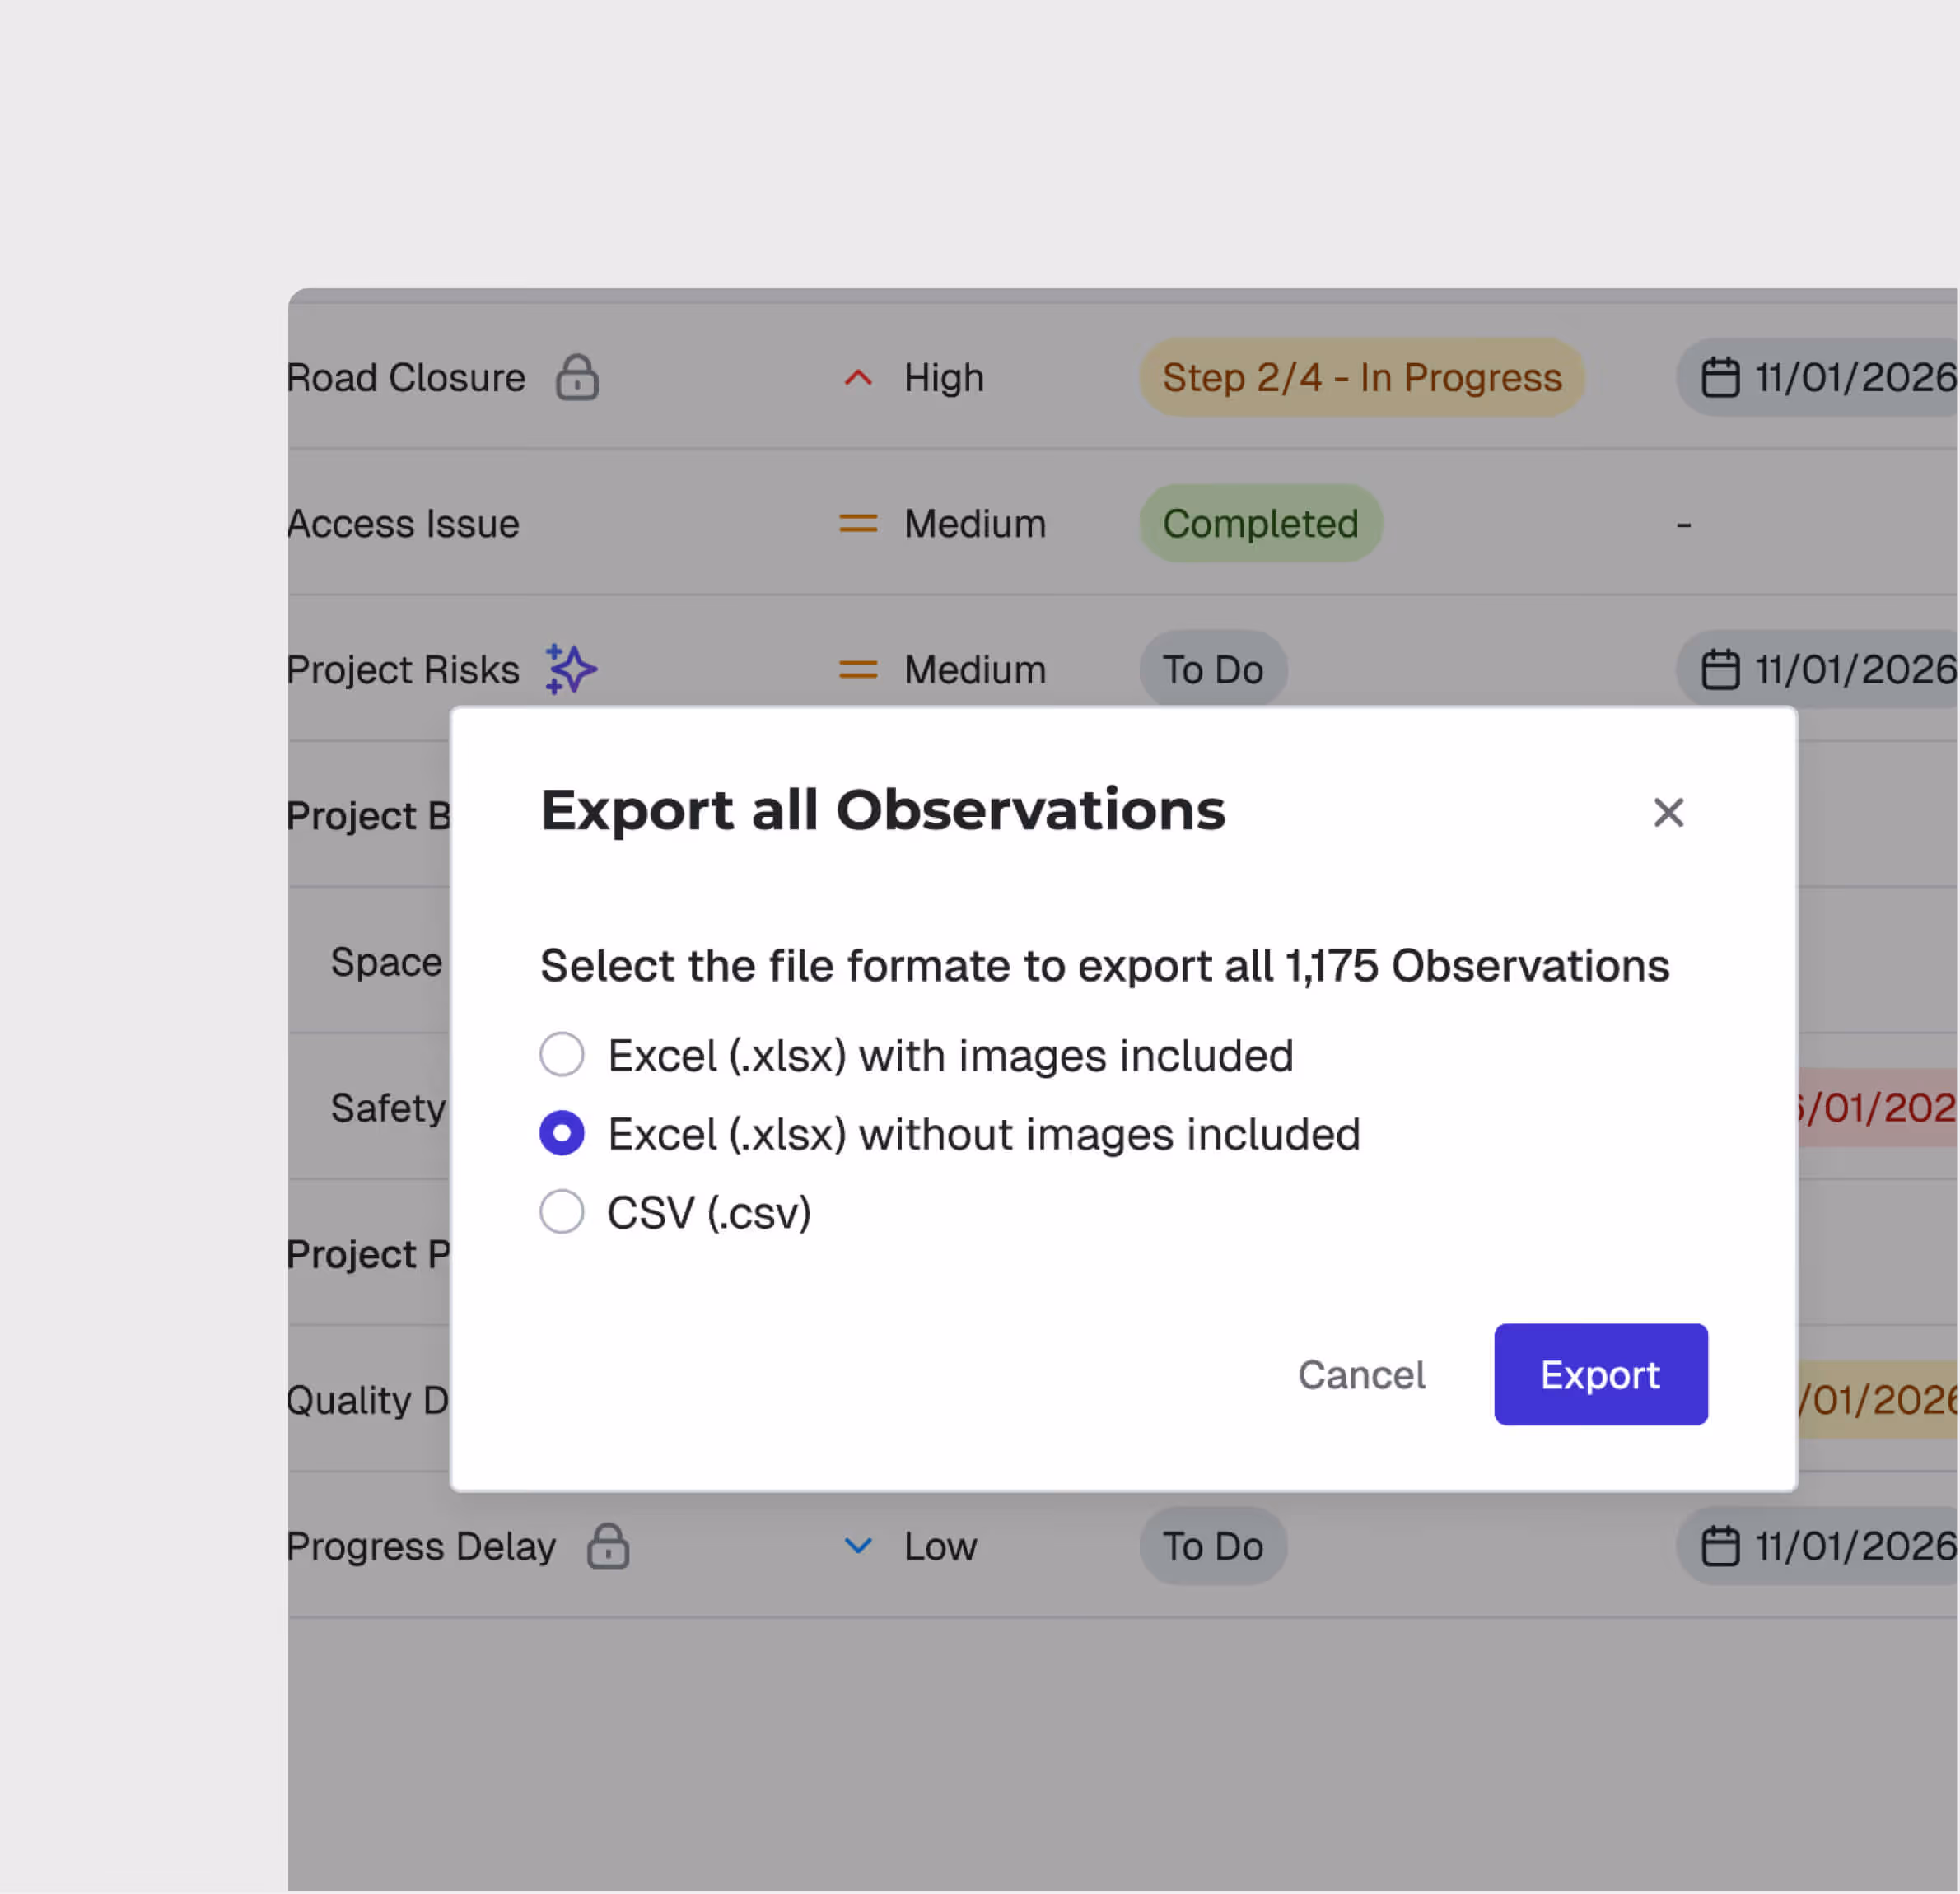
Export & Reporting
Export observation logs as PDF or Excel reports. Generate analytics on observation patterns, recurrent issues, and team response performance.
Observations is most useful for:
QA/QC Engineers
Real-Time Field Reporting
Log safety, quality, and environmental observations from the field in seconds — with automatic geo-tagging and photo attachment.
Site Managers
Safety Observation Tracking
Monitor site safety observations, track resolution rates, and identify recurring hazard patterns for proactive risk management.
Project Managers
Issue Resolution Oversight
View all open observations across the project, monitor SLA compliance, and ensure nothing escalates due to delayed response.
"Our average observation resolution time dropped from 5 days to 8 hours using WhiteHelmet Observation Management. Nothing gets lost anymore. Everything is organized and geotagged with evidence."
.avif)
Frequently asked questions
Yes. All geo-tagged incidents are displayed on the GIS map, enabling spatial analysis of incident patterns and high-risk zone identification.
GIS 3D supports IFC and RVT for BIM models, LAS/LAZ for point clouds, and standard image formats for drone orthomosaics and aerial imagery.
Yes. GIS 2D and GIS 3D share the same geospatial foundation. You can switch between 2D planning views and 3D visualization views seamlessly.
When an incident is logged, the user selects the appropriate SOP-based workflow based on incident type and severity, guiding investigators through each required step.
WhiteHelmet products Observations works well with

Field Intelligence

Project Management Intelligence
Tools that work alongside this product

WhiteHelmet Applications are available in both Google Play and App Store.