
AI Visual Pollution
AI-powered environmental monitoring that detects visual pollution from images automatically.
Keep your Site Clean and Safe.
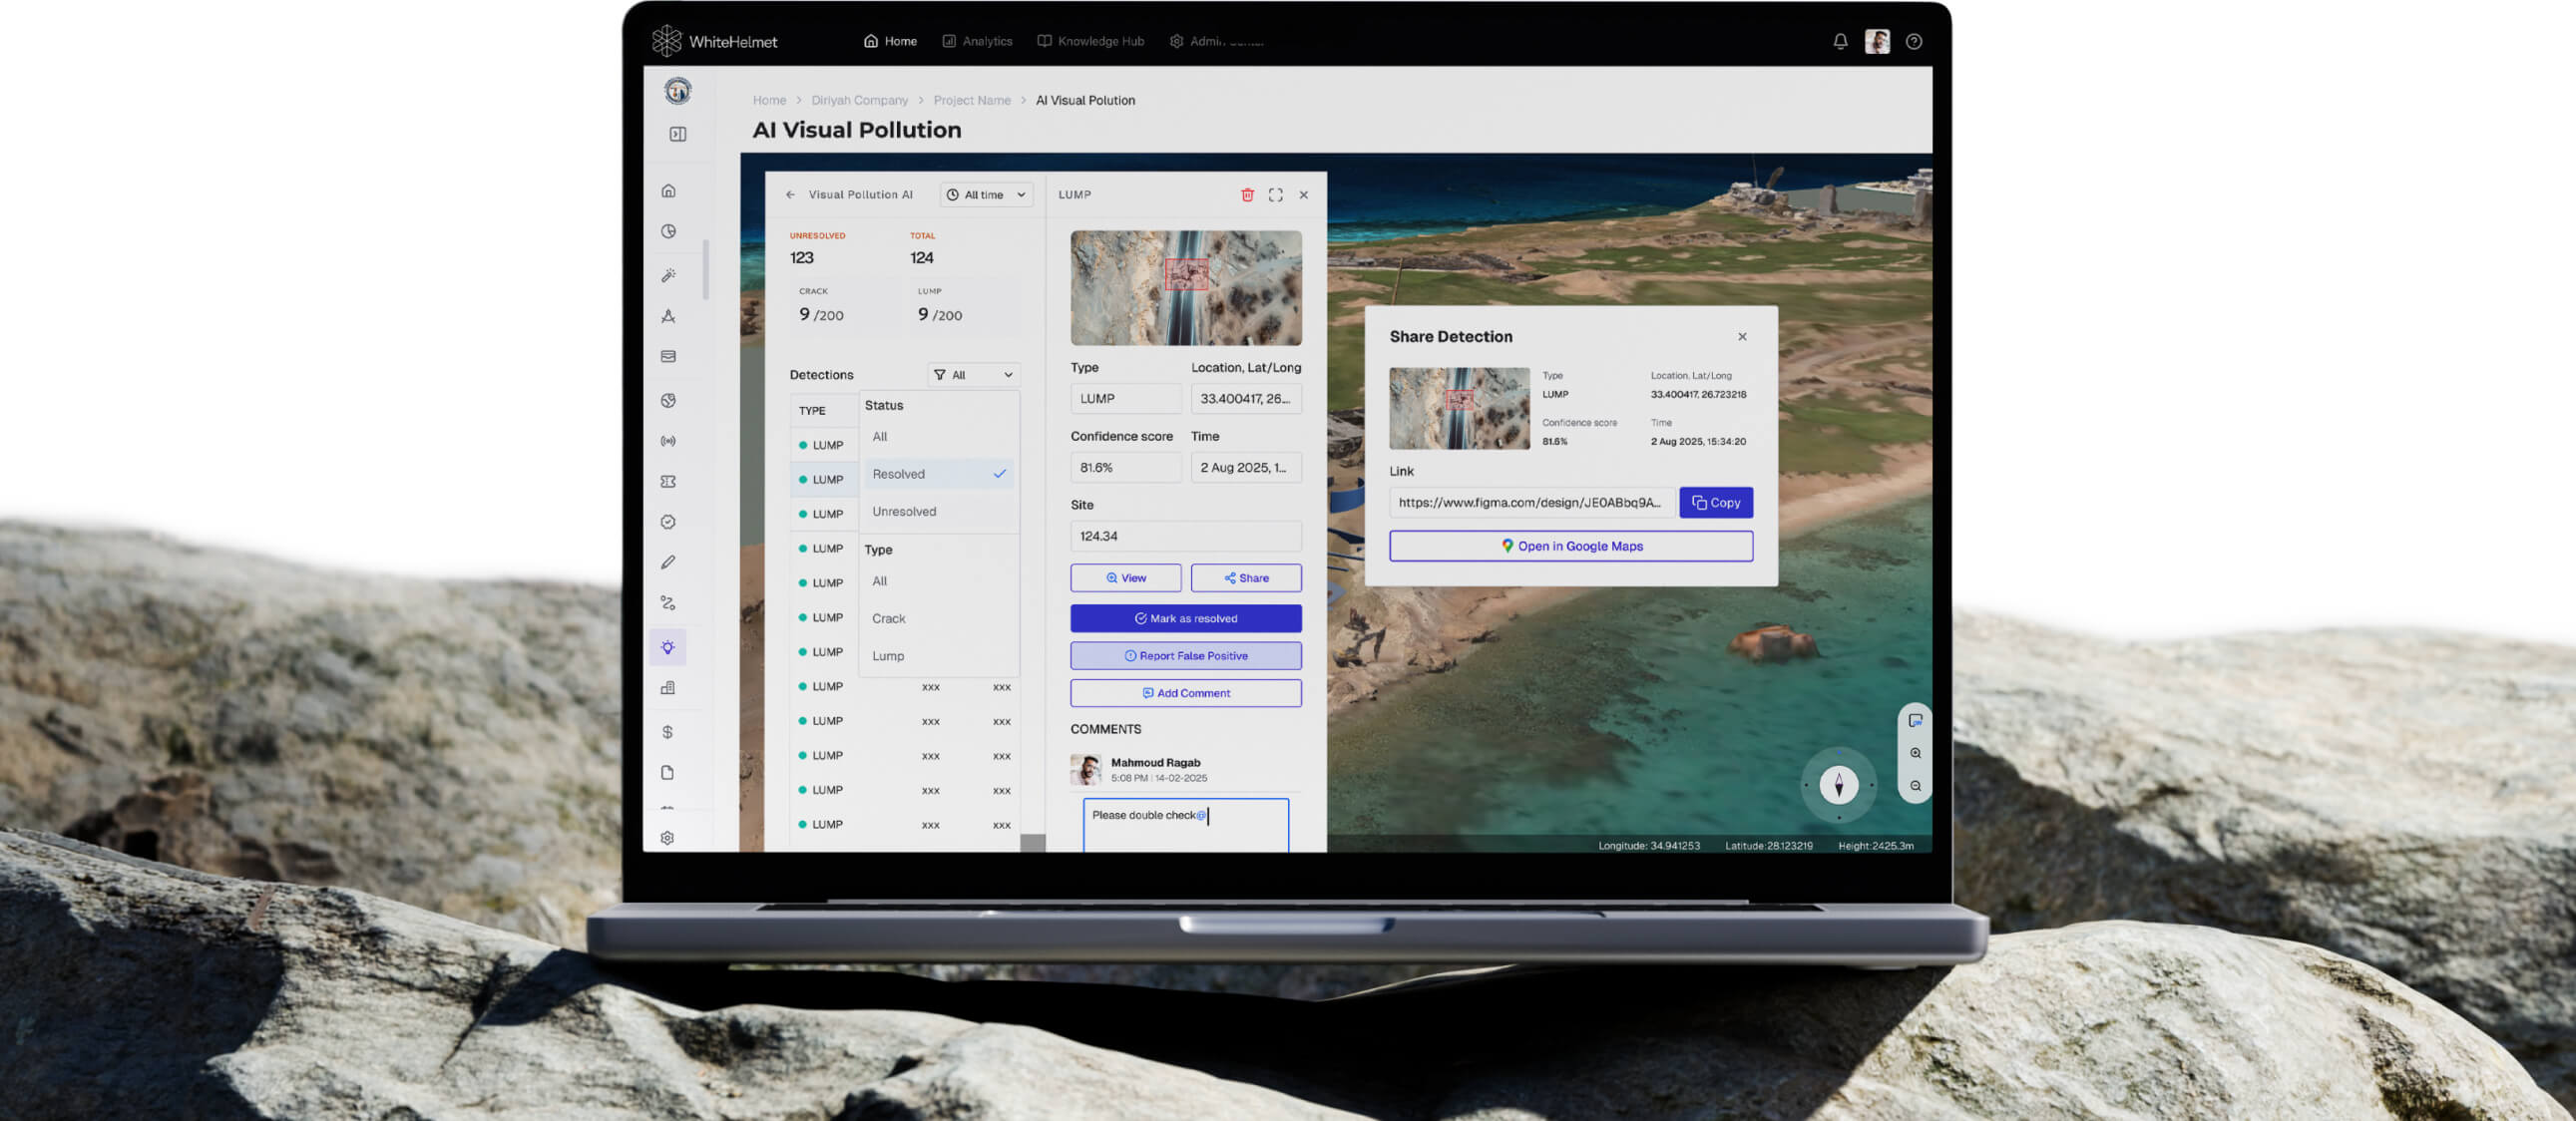
Upload drone images and let AI detect environmental pollution — waste accumulation, broken civil assets, stray animals, and construction waste. AI Visual Pollution frees manual site visit checks and allows you to optimize your resources based on real data, not randomized outsourcing.
AI Pollution Detection from Images
Multi-Category Violation Detection
Geo-Referenced Violation Mapping
Comment, Resolve, and Issue Detections
Trend Analytics & Dashboard
AI Detection Engine
Upload drone images and the AI automatically identify pollution types — waste, broken civil assets, stray animals, and construction waste — with confidence scores and bounding boxes.
Multi-Category Detection
The system recognizes multiple pollution categories simultaneously, classifying each detection by type, severity, and geolocation.
.avif)
.avif)
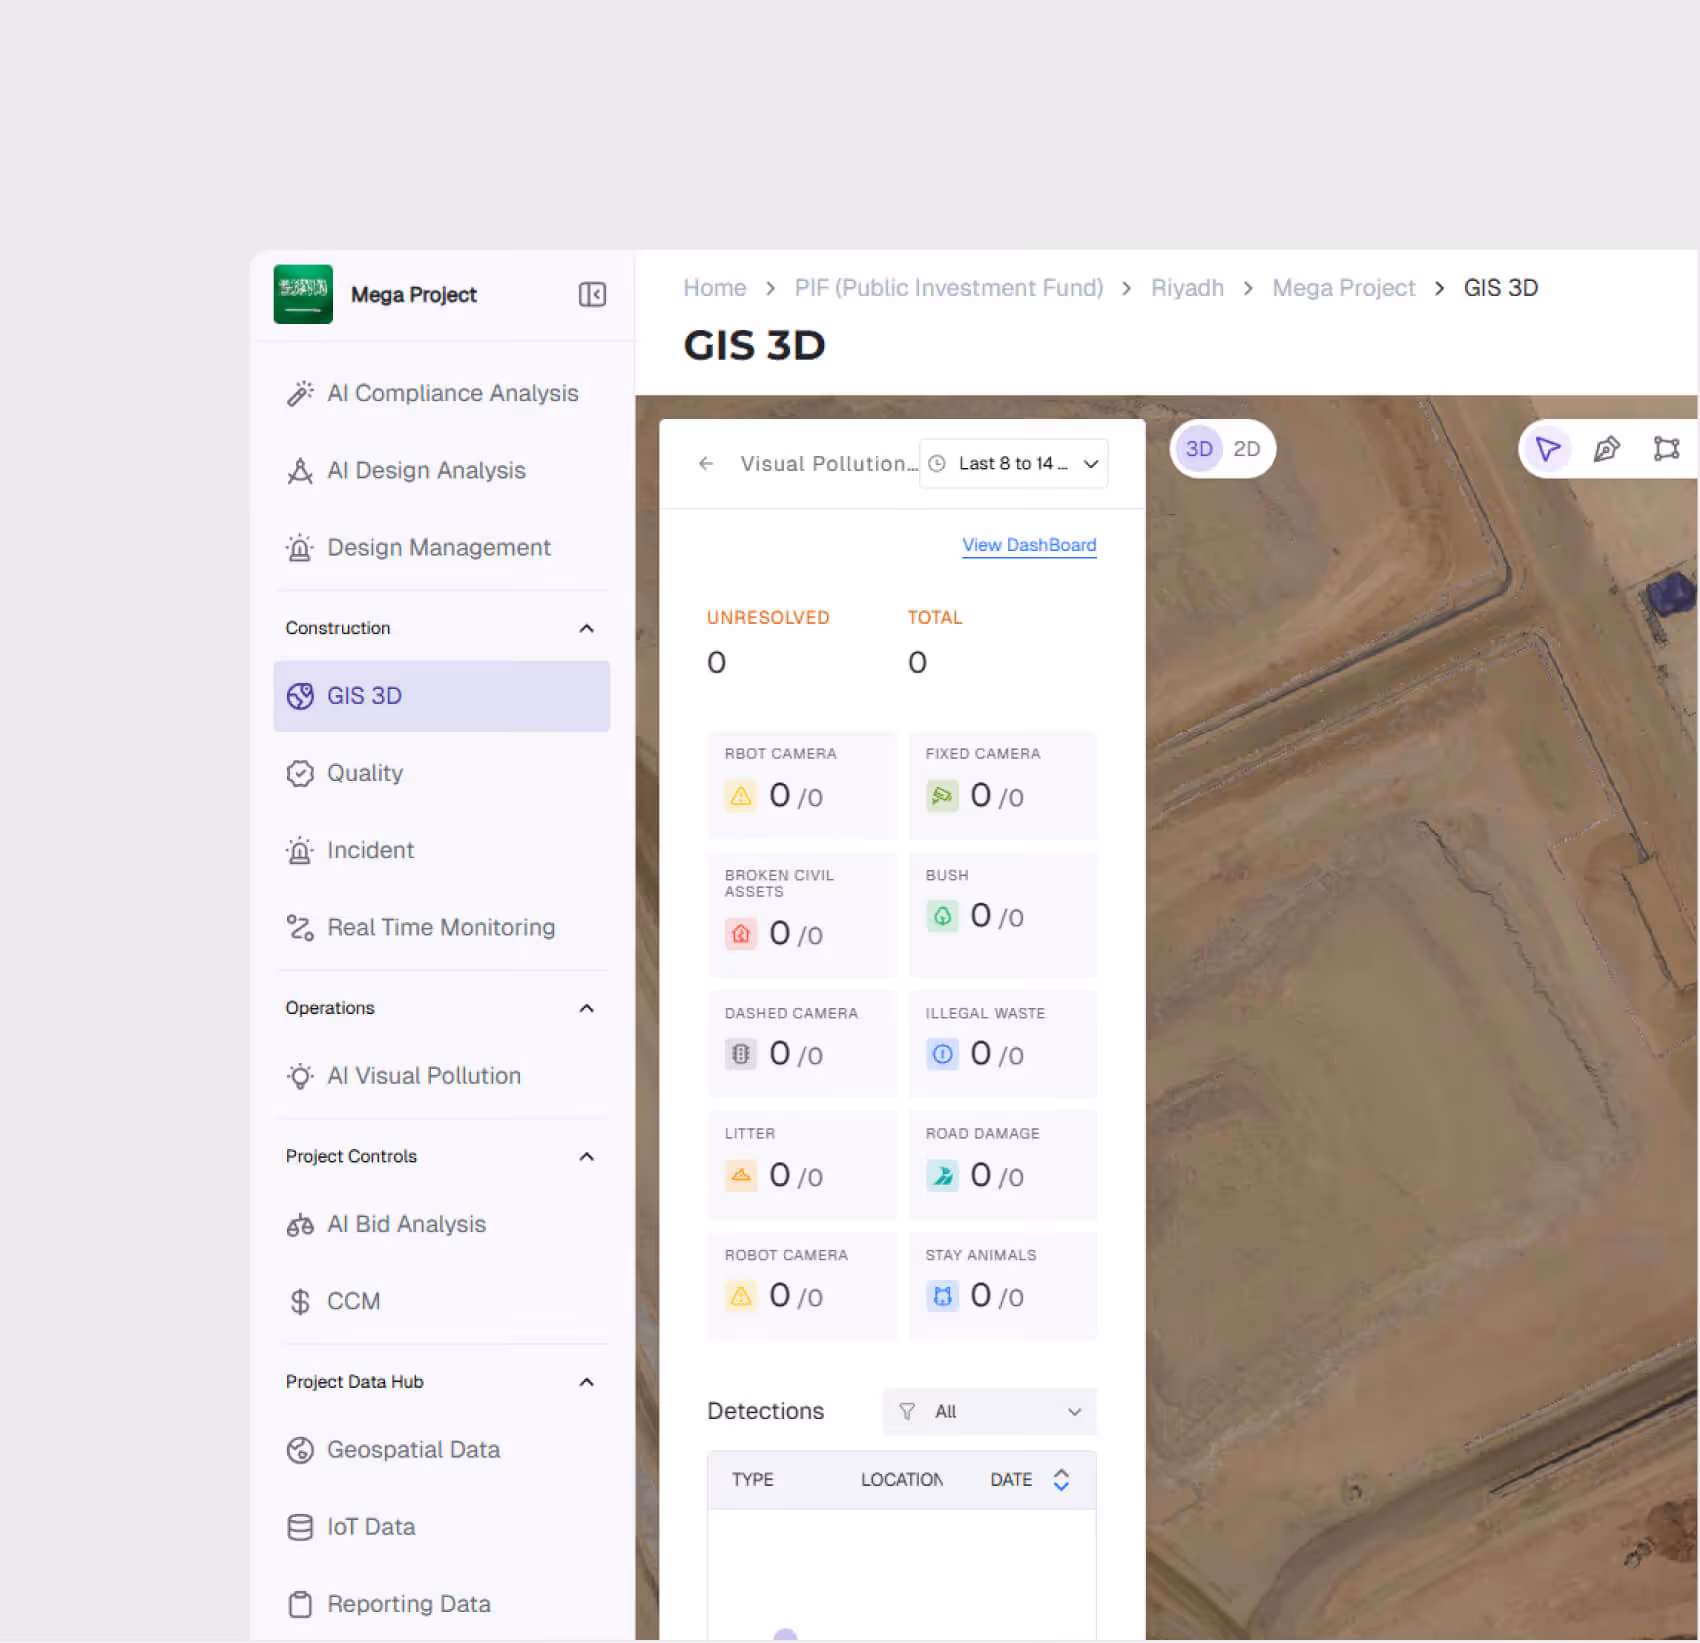
Geo-Referenced Violation Mapping
Detections are mapped to their spatial location on the project GIS, enabling zone-level environmental monitoring and hotspot identification.
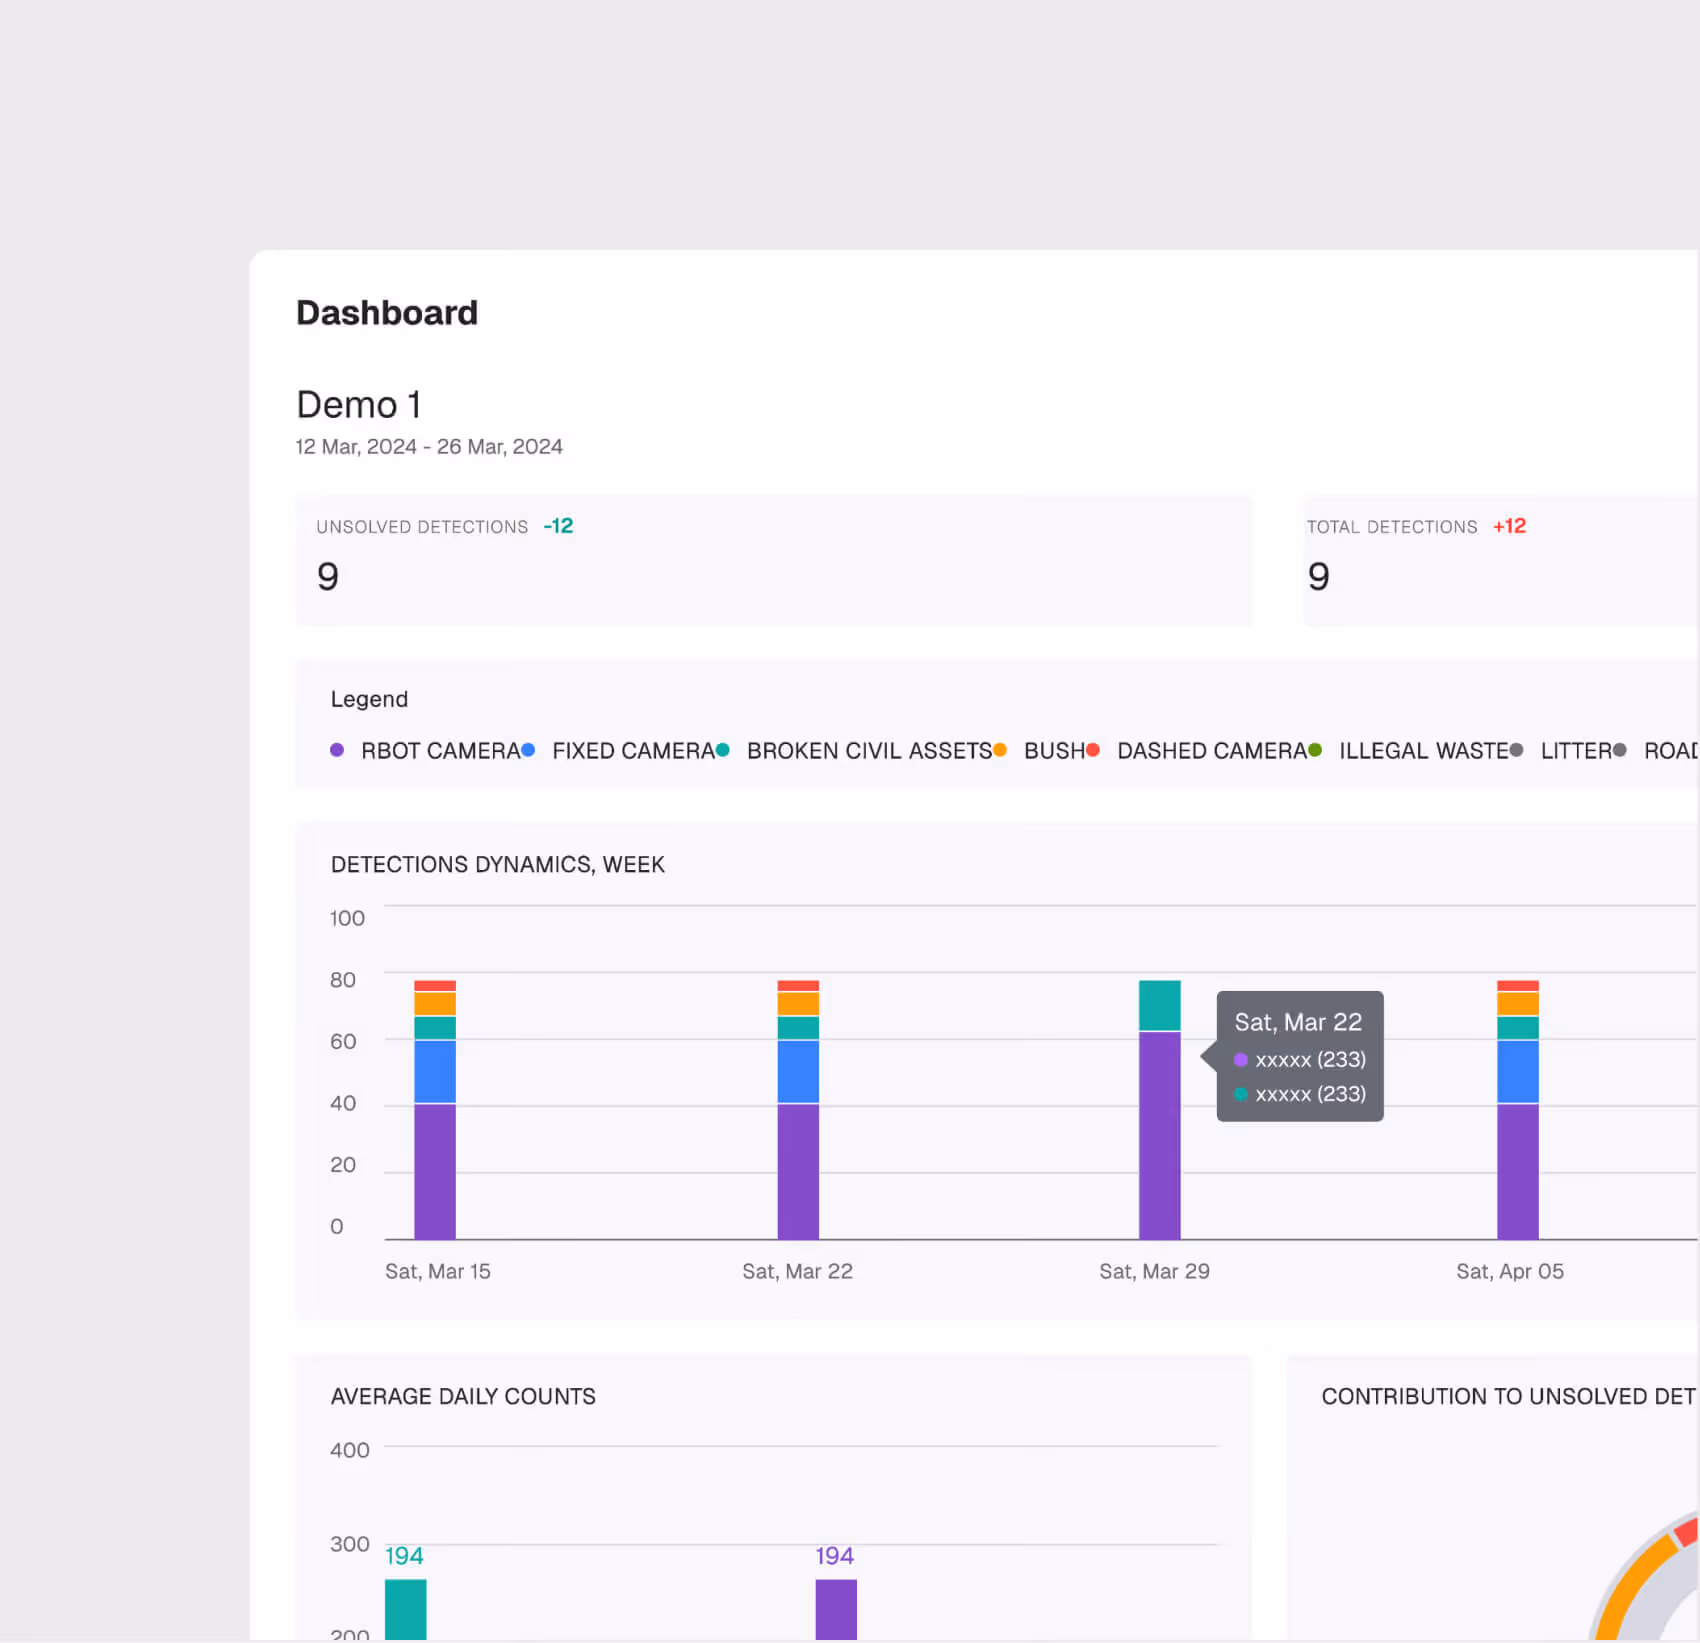
Compliance Trend Analytics
Track pollution detection trends over time — frequency, types, zones, and resolution rates — to demonstrate environmental due diligence to regulators.
AI Visual Pollution is most useful for:
Environmental Officers
Automated Compliance Monitoring
Replace manual environmental inspections with AI-powered image analysis that monitors site conditions continuously and flags violations before they escalate.
Municipality Supervisors
Proactive Site Management
Get early warning of environmental issues that could trigger regulatory stop-work orders, allowing corrective action before inspectors arrive.
HSE Directors
Portfolio Environmental Oversight
Monitor environmental compliance across all project sites from a single dashboard, with trend data for management reporting and regulatory submissions.
"We used to deploy 14 drivers across 30 locations for site visits and manual identification of visual pollution. Now we deploy 1 pilot across 30 locations and know exactly where to focus our efforts."
.avif)
Frequently asked questions
You have the right to access, correct, or request deletion of your personal data at any time. Submit a request to info@whitehelmet.com.
Data is stored on Oracle Cloud Infrastructure (OCI) located geographically within the Kingdom of Saudi Arabia, in compliance with local data residency requirements.
GIS 2D focuses on 2D planning overlays, schedule integration, and zone-level progress tracking. GIS 3D adds 3D visualization with BIM, point cloud, drone analysis, and reality capture comparison.
Yes. Multiple users can add annotations simultaneously. Each annotation is saved with structured metadata, timestamps, and user attribution.
Yes. The web-based interface is responsive and accessible from tablets and mobile devices in the field, enabling real-time map access on-site.
Every upload creates a version record with metadata. You can compare any two versions visually and view a full change log.

