
Quality Management
SOP-enforced quality inspections with digital checklists and real-time compliance tracking.
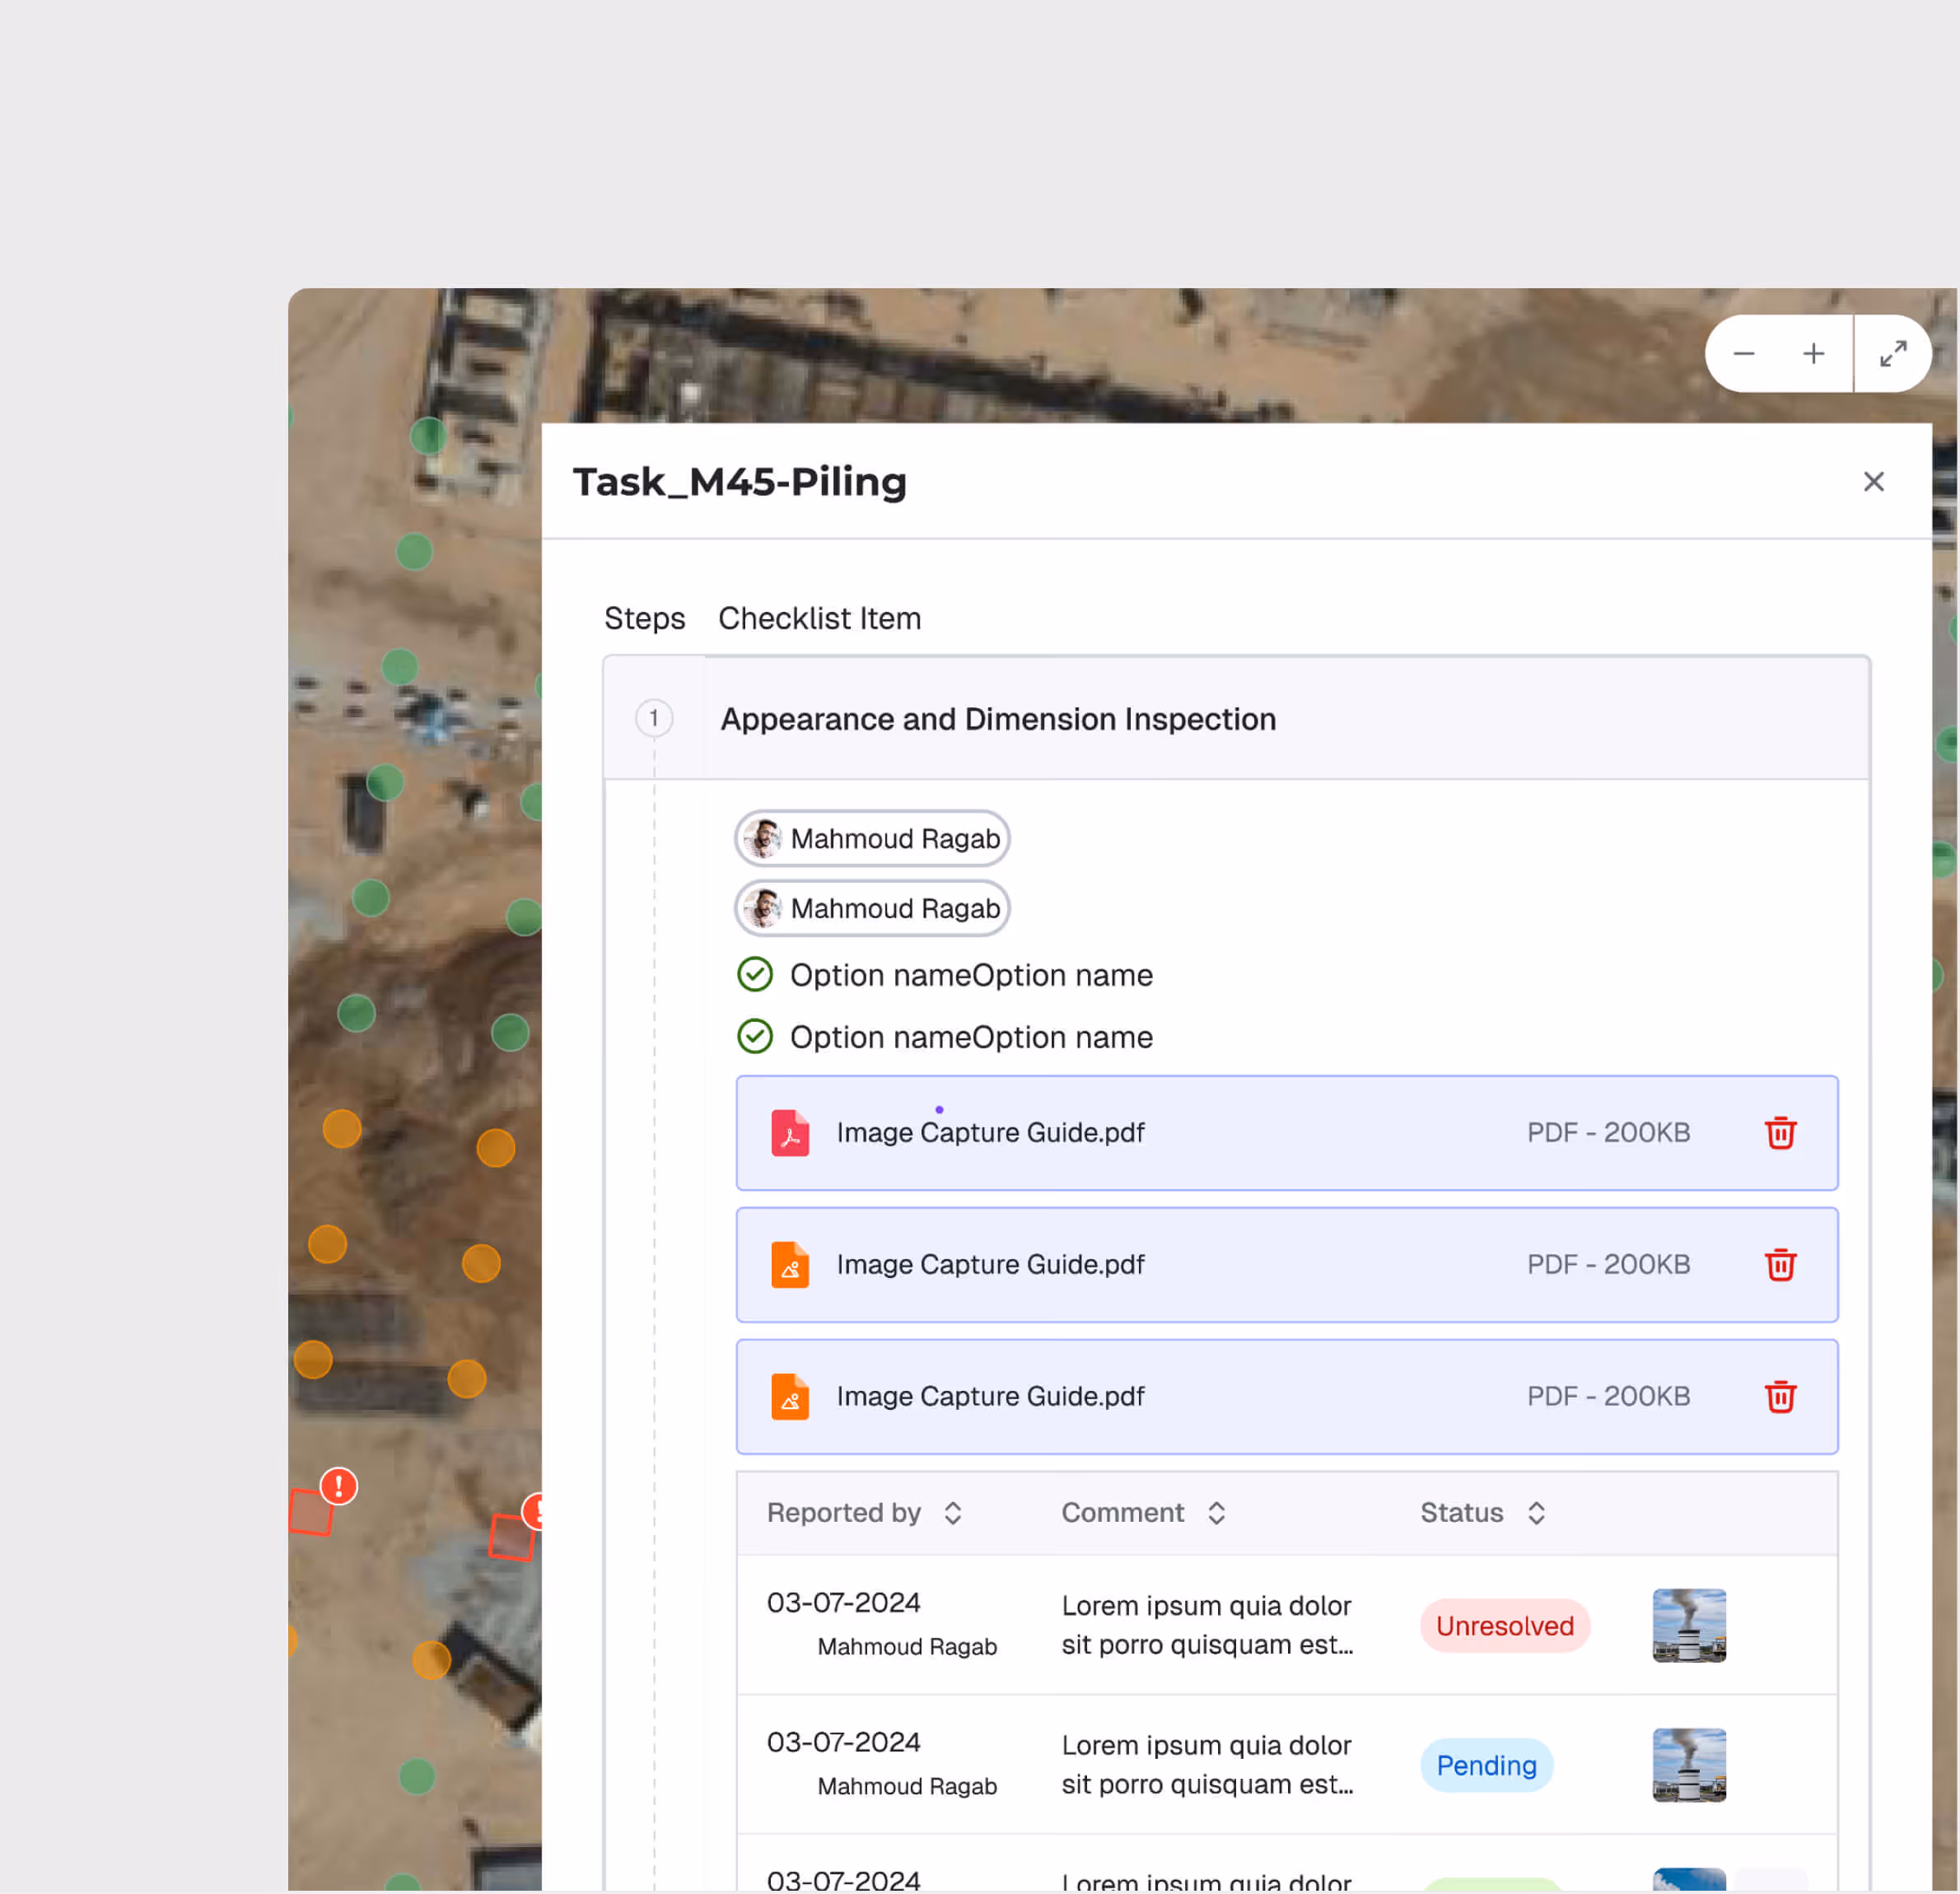
Inspect Right the First Time. Every Time.
Digitize quality inspections with SOP-enforced checklists, track inspection results in real time, and ensure every work item is verified before sign-off. Quality Management eliminates the rework cycle by catching defects at the source.
SOP-Enforced Digital Checklists
Real-Time Inspection Tracking
Quality Analytics Dashboard
Defect-to-Resolution Workflow
Spatial Quality Mapping

SOP-Enforced Inspections
Create and manage SOPs with mandatory checklist steps. Inspectors follow structured procedures with required evidence capture — ensuring no steps are skipped.
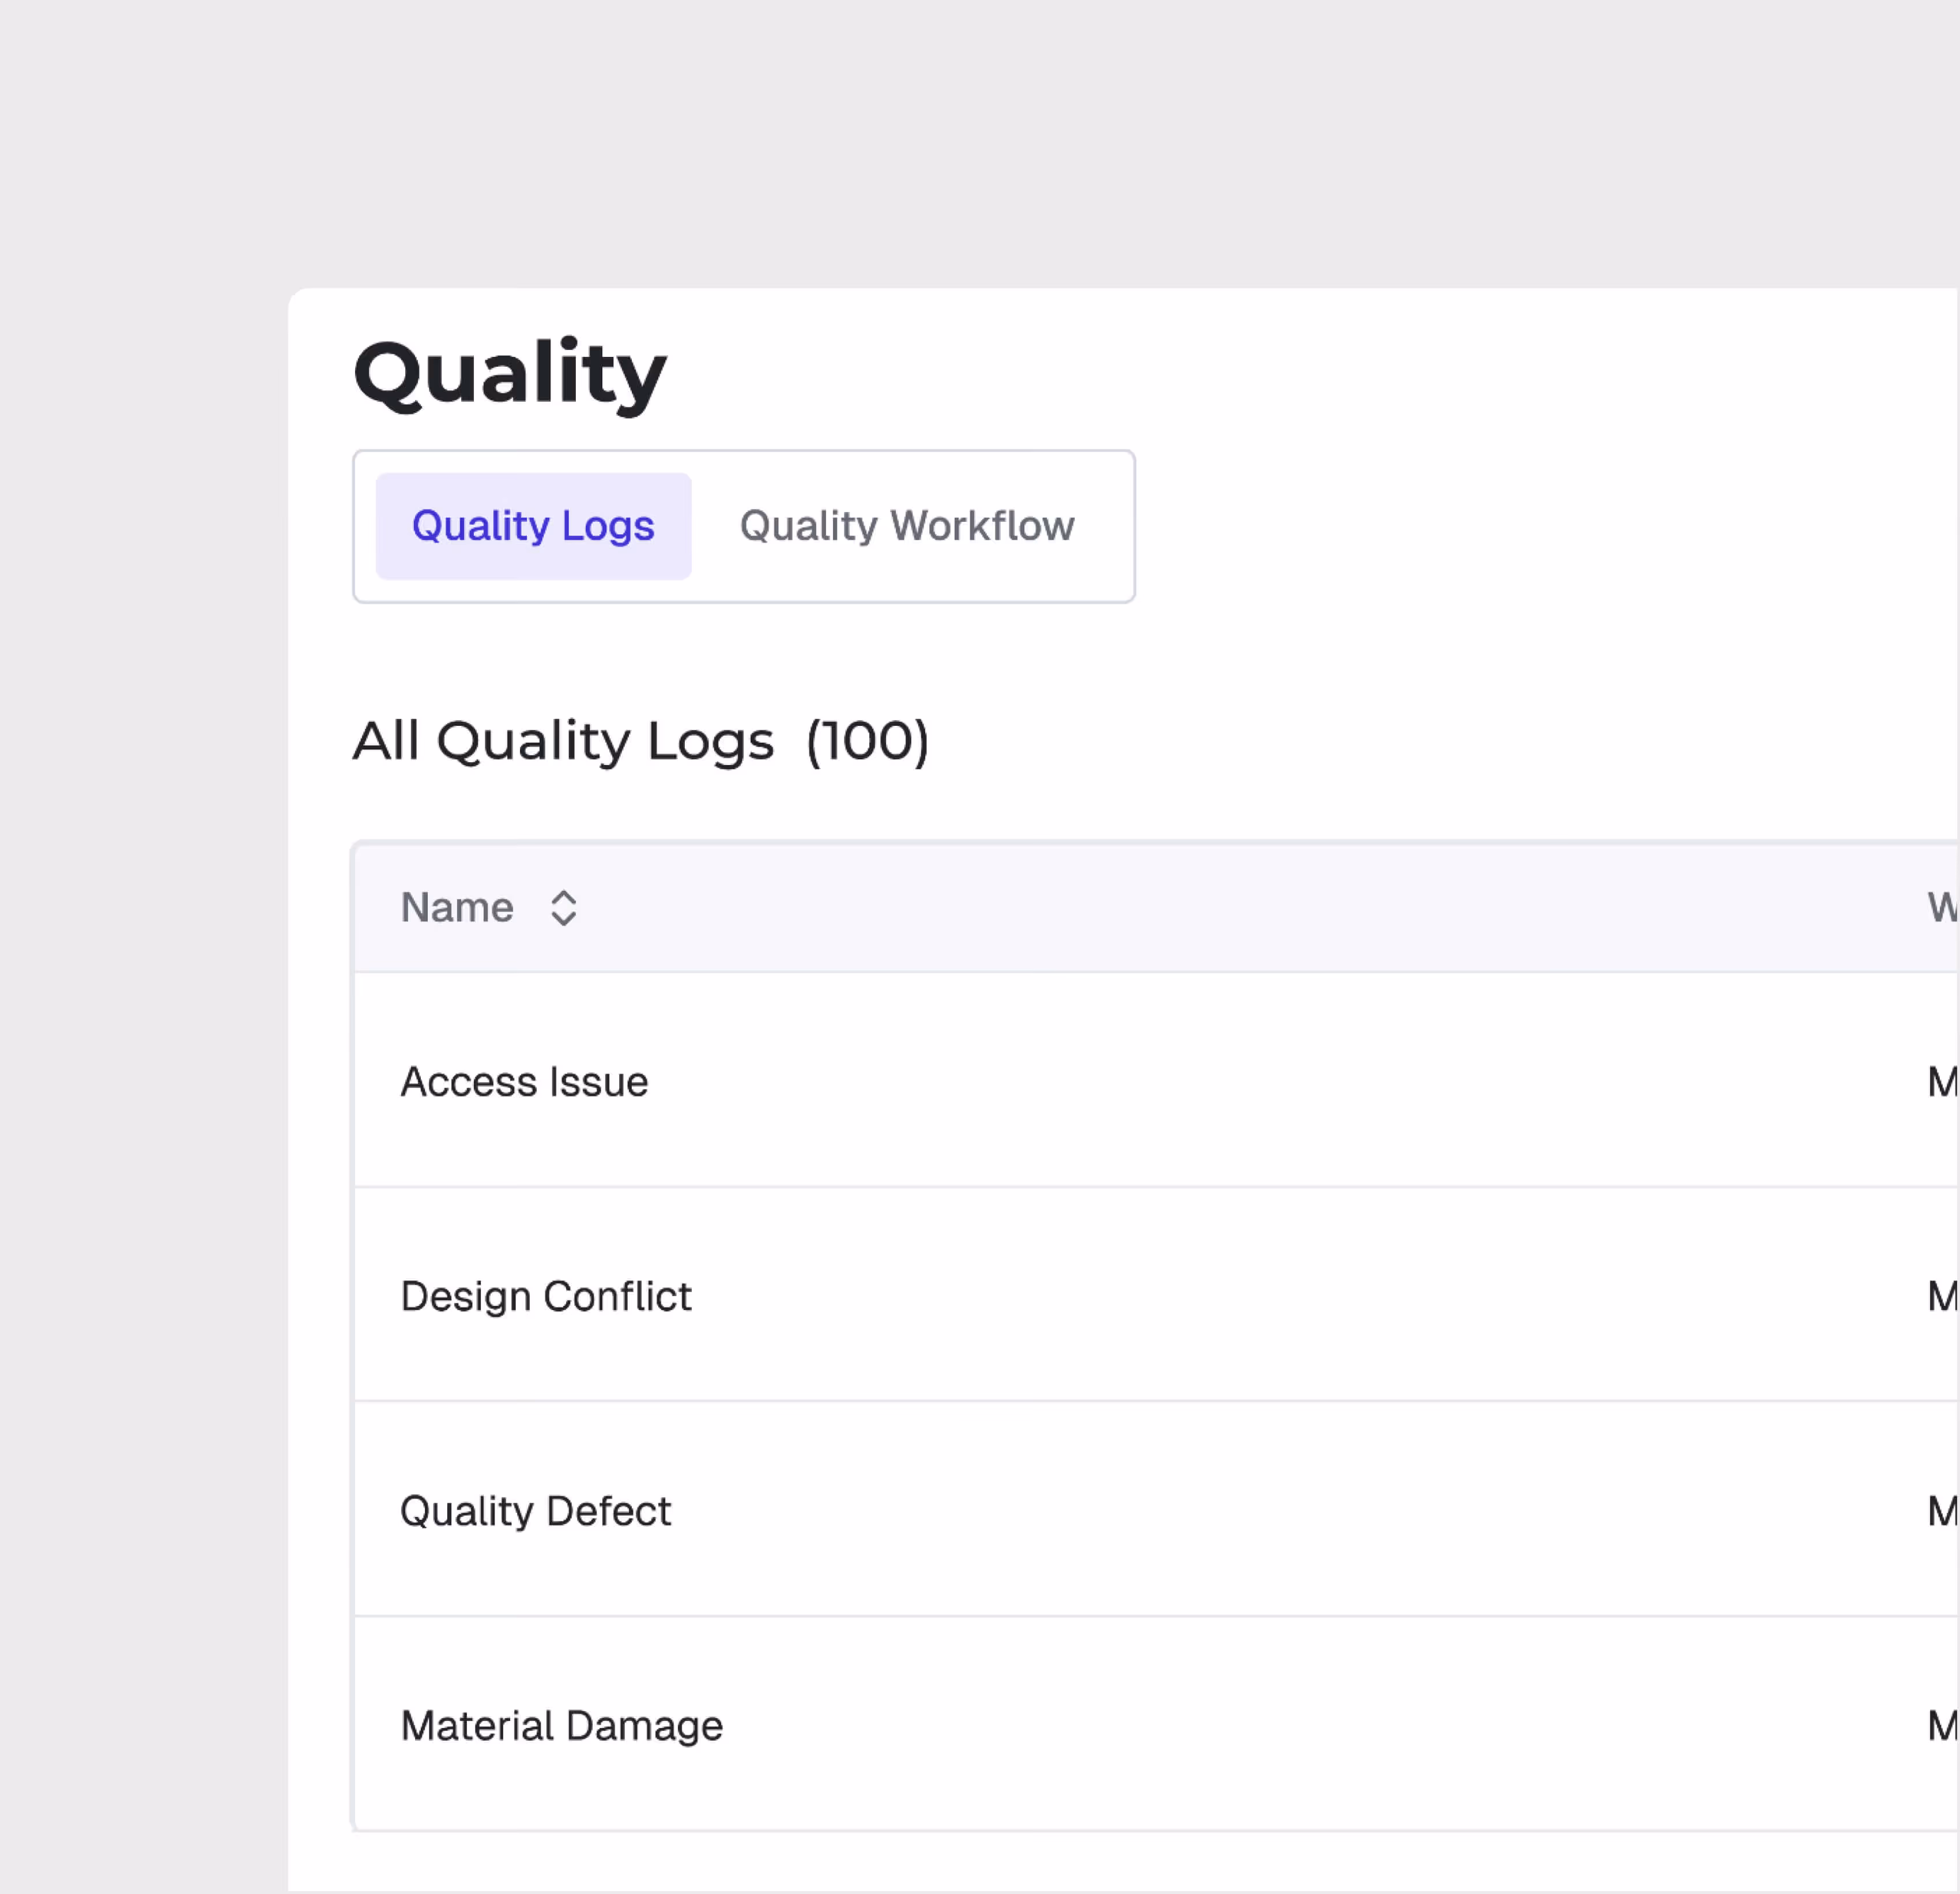
Quality Log Management
Manage all quality logs centrally — track inspection results, non-conformances, and corrective actions through a structured lifecycle with role-based access.
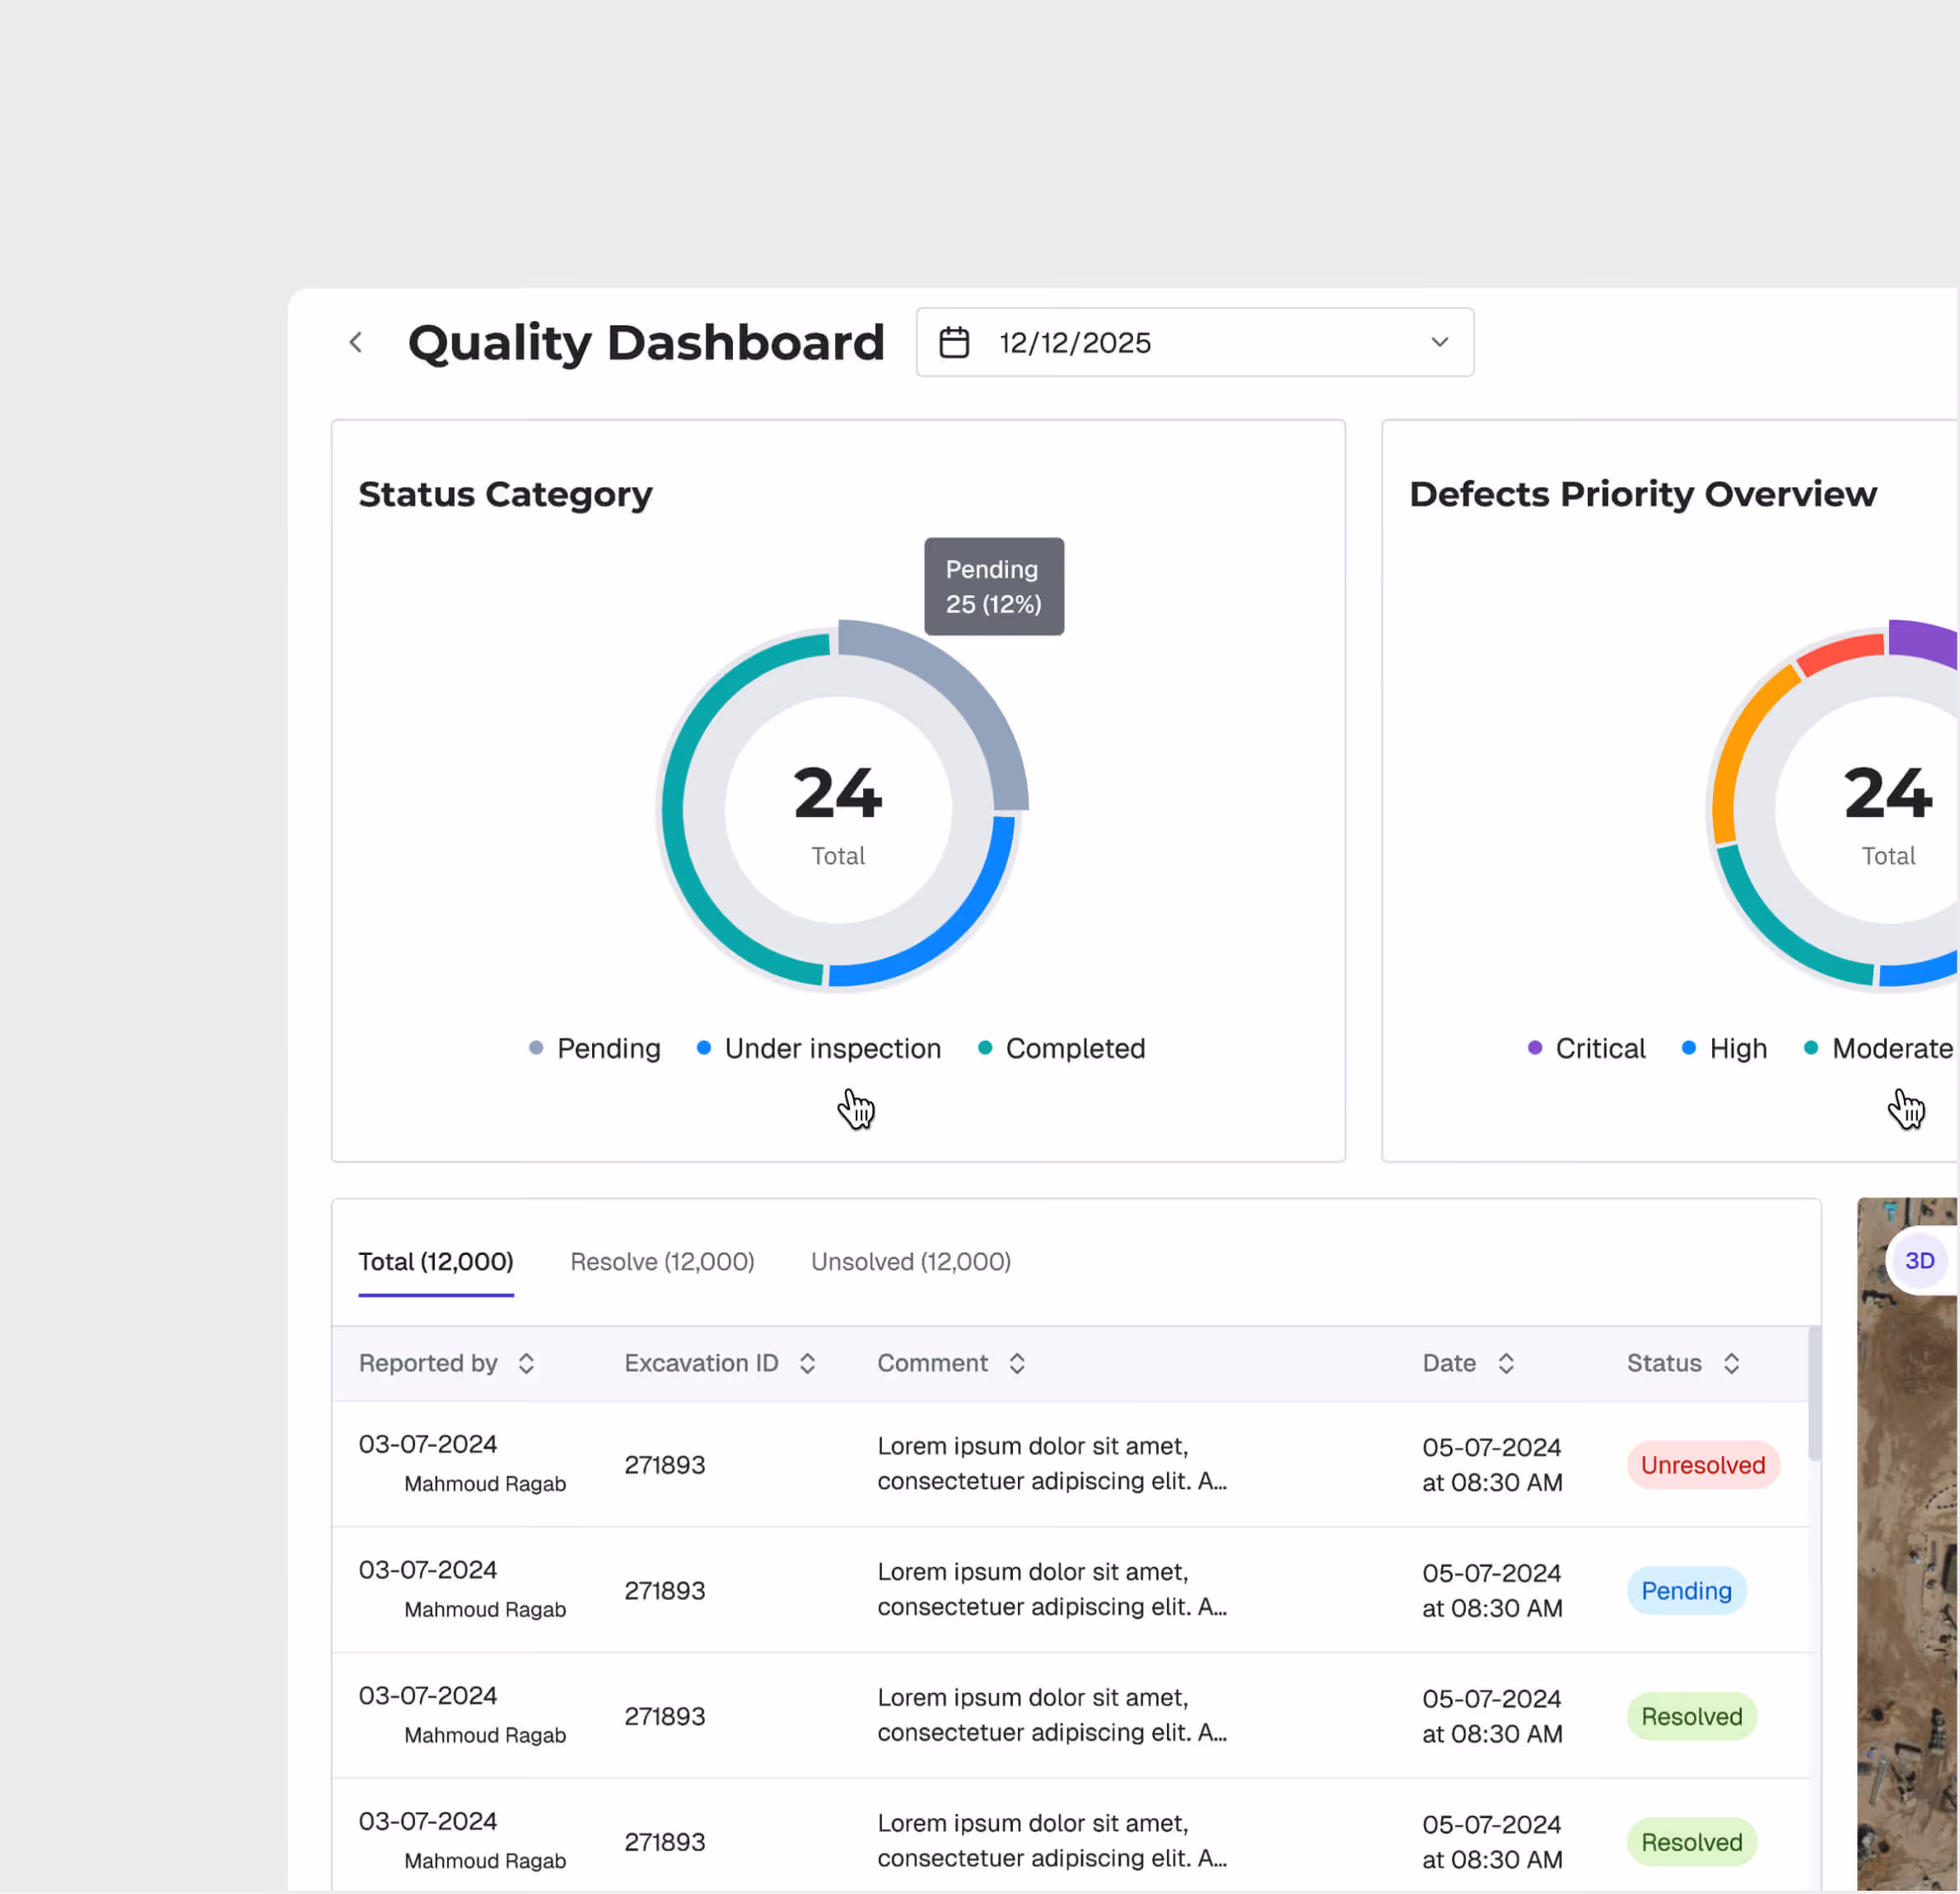
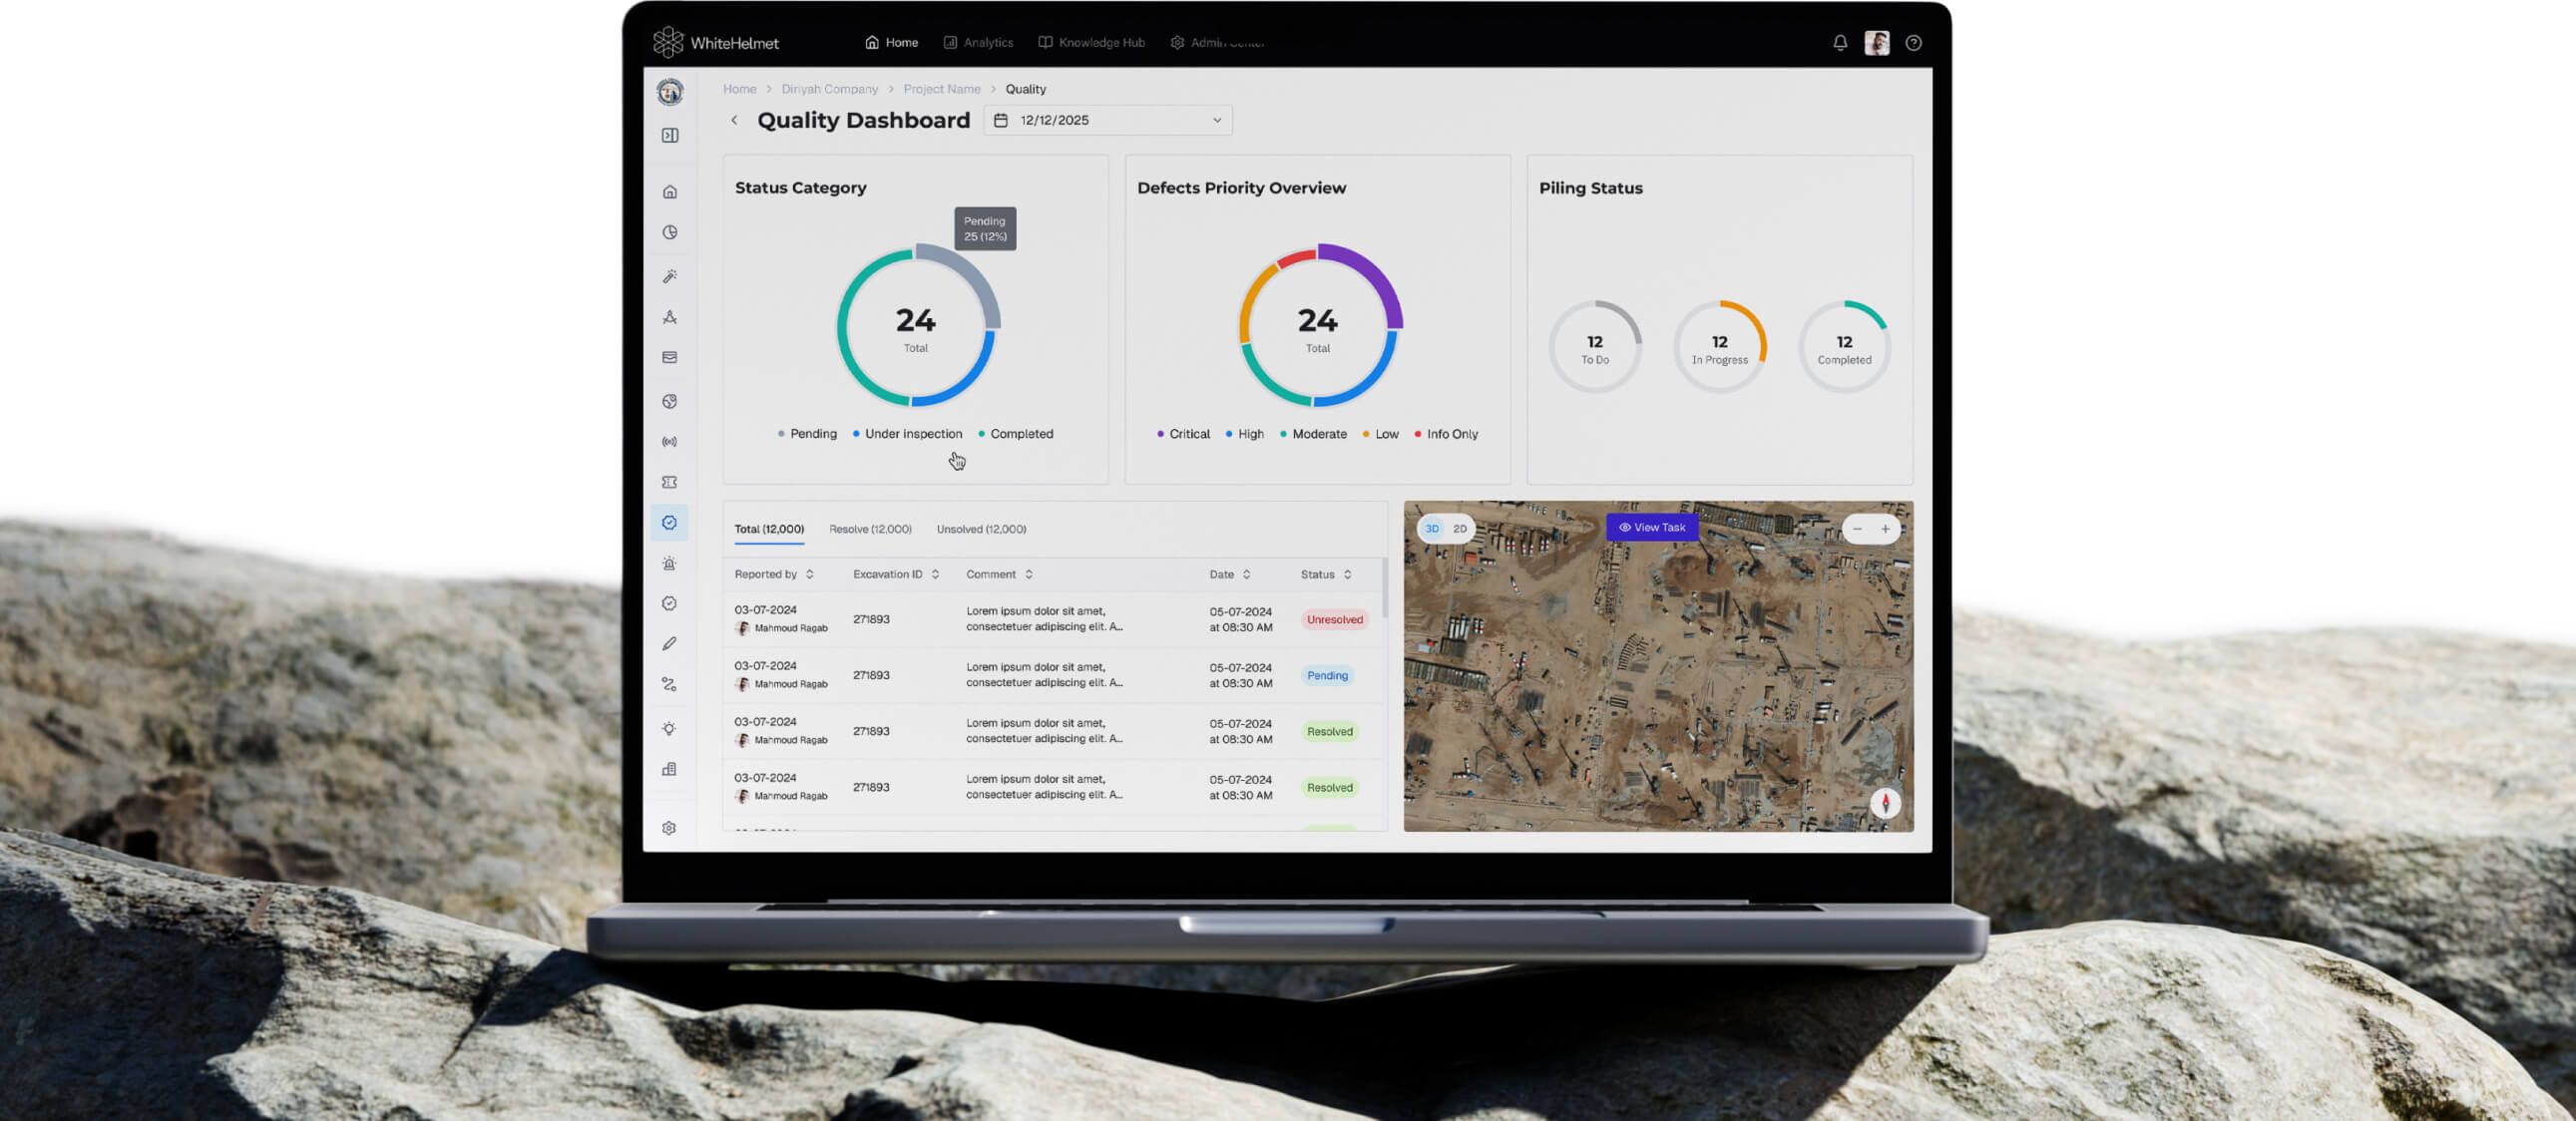
Real-Time Quality Dashboard
Monitor inspection pass/fail rates, non-conformance trends, and corrective action status in real time. Drill down by zone and item.
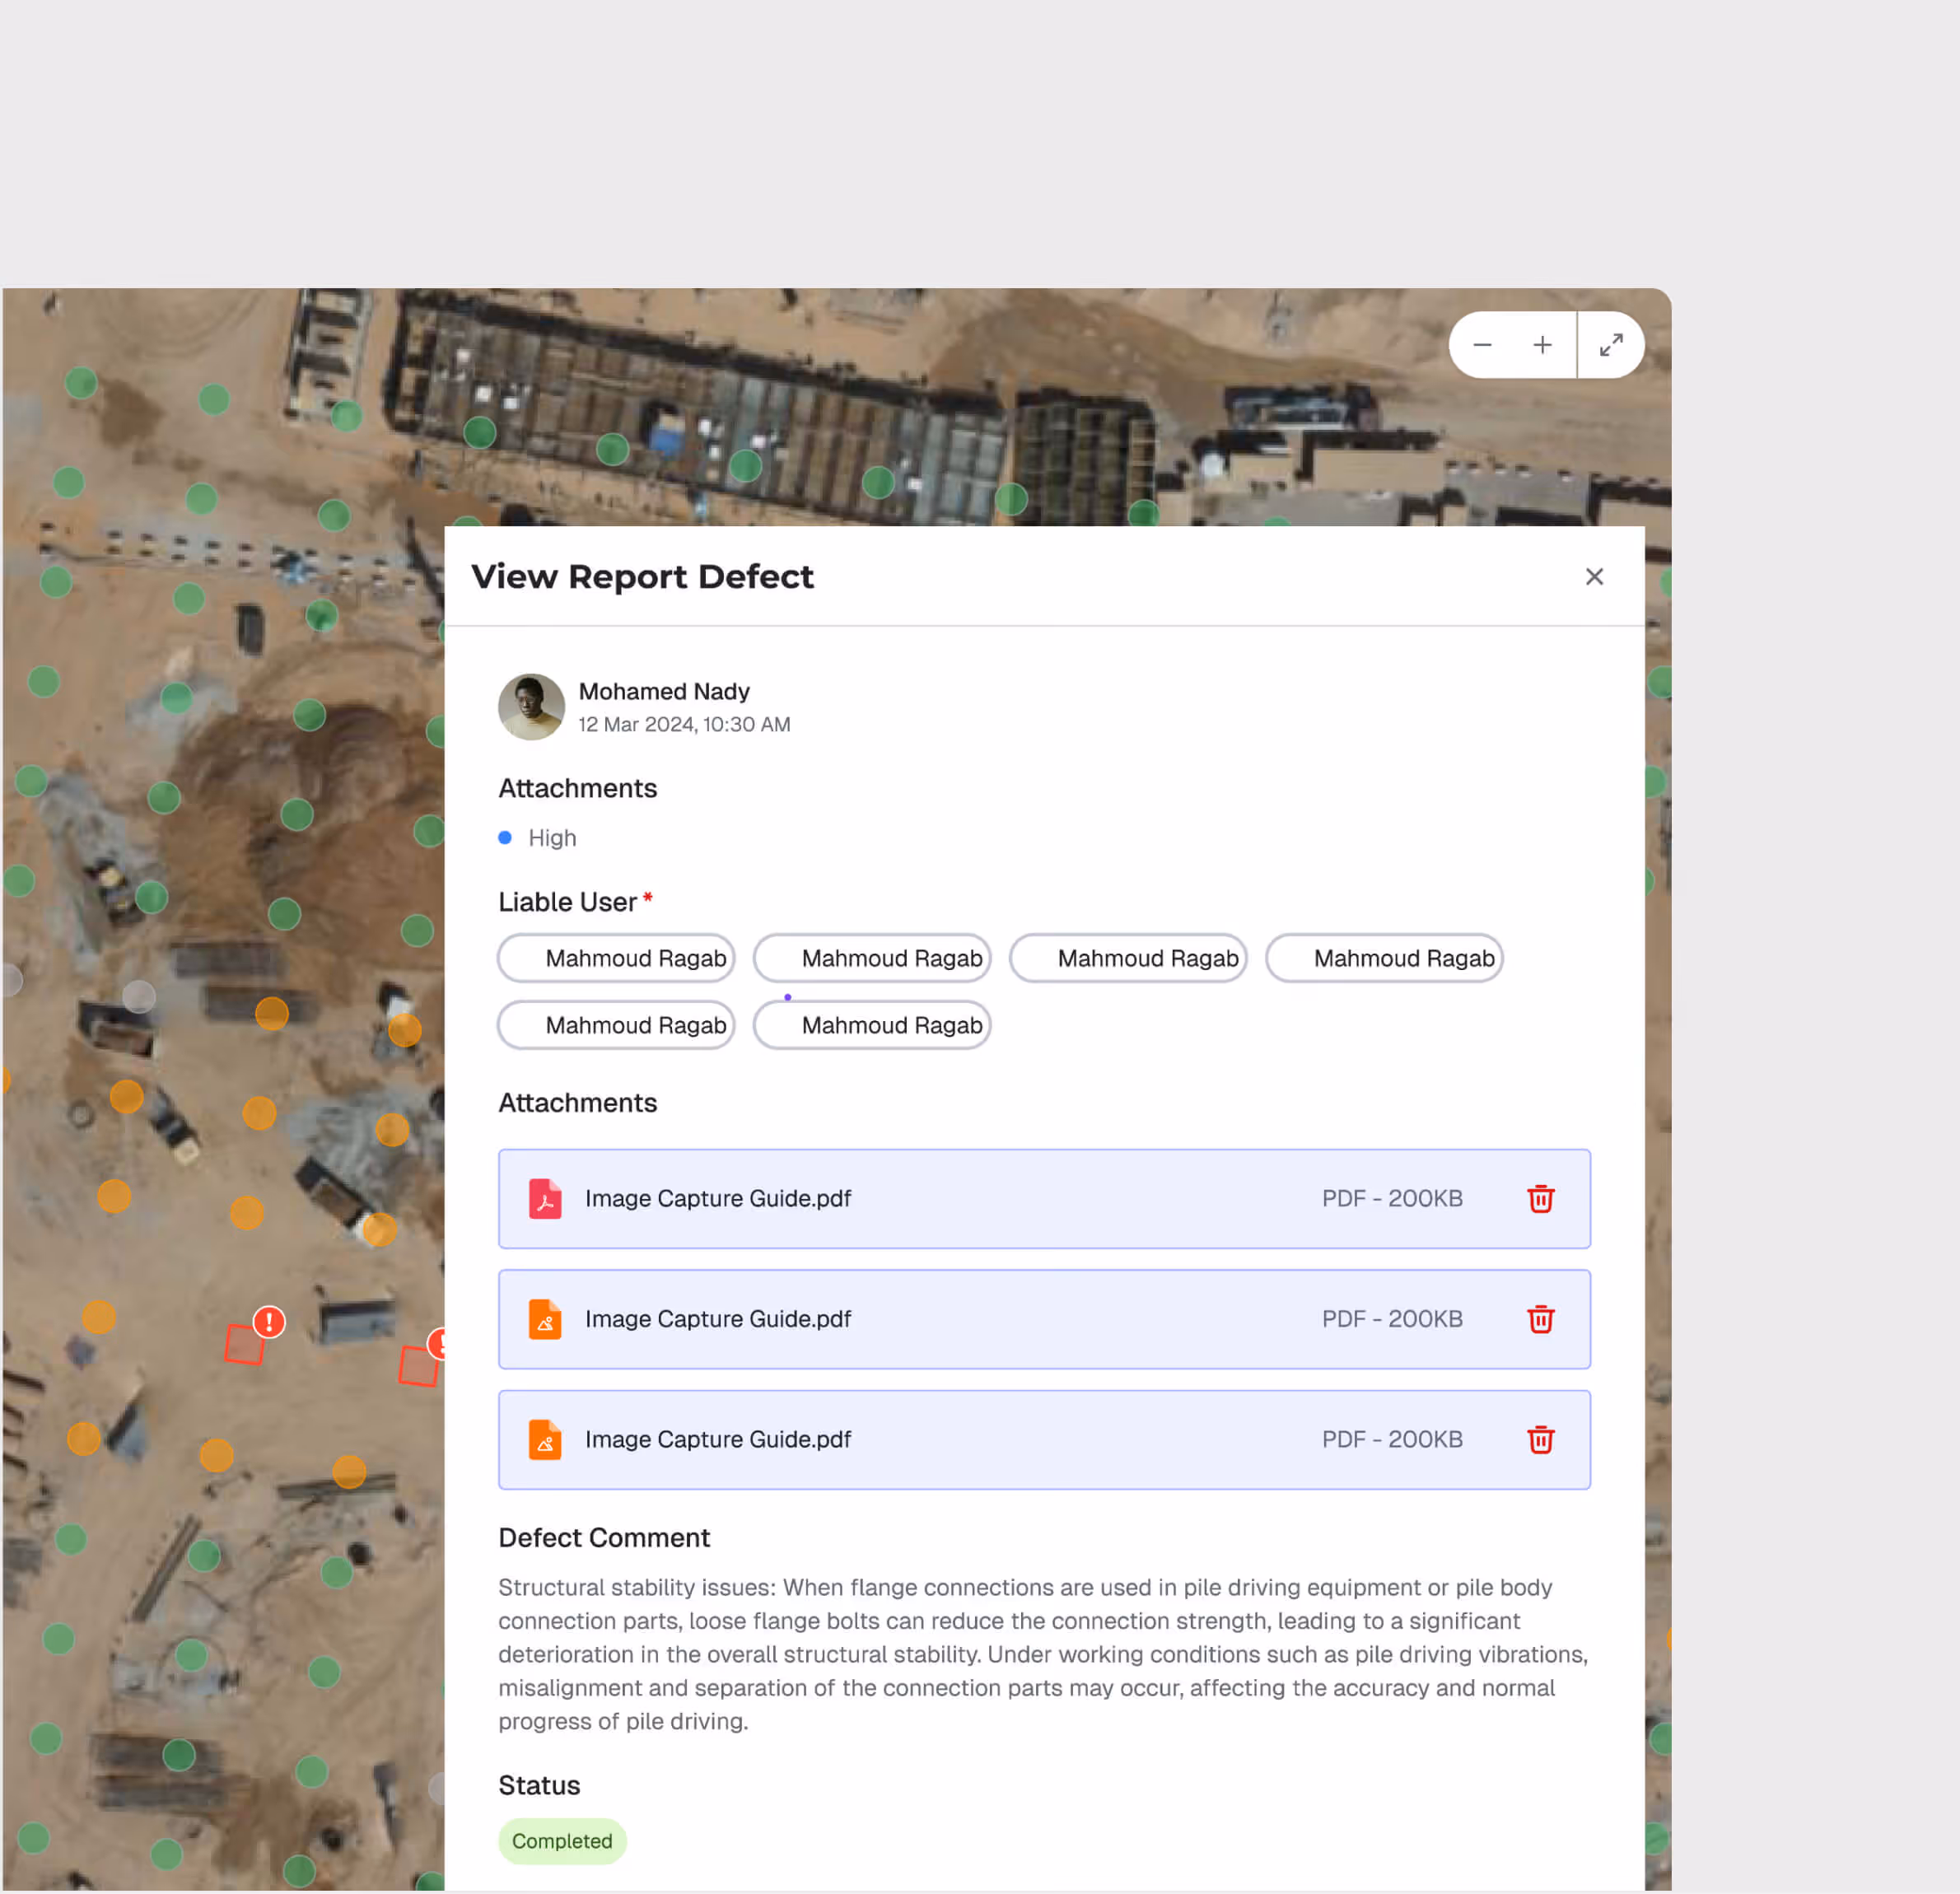
Spatial Quality Visualization
View quality inspection results on the project map. Identify zones with recurring quality issues and allocate resources to problem areas proactively.
Workflow Monitoring & Notifications
Configure workflow stages for quality approvals. Automated notifications keep all stakeholders informed of inspection status, pending approvals, and overdue items.
Quality Management is most useful for:
QA/QC Engineers
Digital inspection execution
Execute quality inspections using SOP-enforced digital checklists with photo evidence capture — replacing paper forms and ensuring consistent procedures.
Quality Managers
Compliance oversight
Monitor quality performance across all zones and contractors, track non-conformance resolution, and generate compliance reports for project milestones.
Project Directors
Quality risk visibility
Get real-time visibility into quality metrics across the project — pass rates, open non-conformances, and contractor performance — for informed decision-making.
"Our rework rate dropped by 40% in the first quarter. When every inspector follows the same SOP with mandatory evidence, defects get caught at the source."
.avif)
Frequently asked questions
Yes. All geo-tagged incidents are displayed on the GIS map, enabling spatial analysis of incident patterns and high-risk zone identification.
GIS 3D supports IFC and RVT for BIM models, LAS/LAZ for point clouds, and standard image formats for drone orthomosaics and aerial imagery.
Yes. GIS 2D and GIS 3D share the same geospatial foundation. You can switch between 2D planning views and 3D visualization views seamlessly.
When an incident is logged, the user selects the appropriate SOP-based workflow based on incident type and severity, guiding investigators through each required step.
WhiteHelmet products Quality Management works well with

Field Intelligence
