
.jpg)
Plan Smarter with Full Visibility.
Overlay Masterplans, CAD drawings, work packages, and schedules onto one interactive map. GIS 2D replaces fragmented or manual planning methods with a single source of spatial truth for your entire project on a digital web-based system.
Interactive CAD & KML Overlay
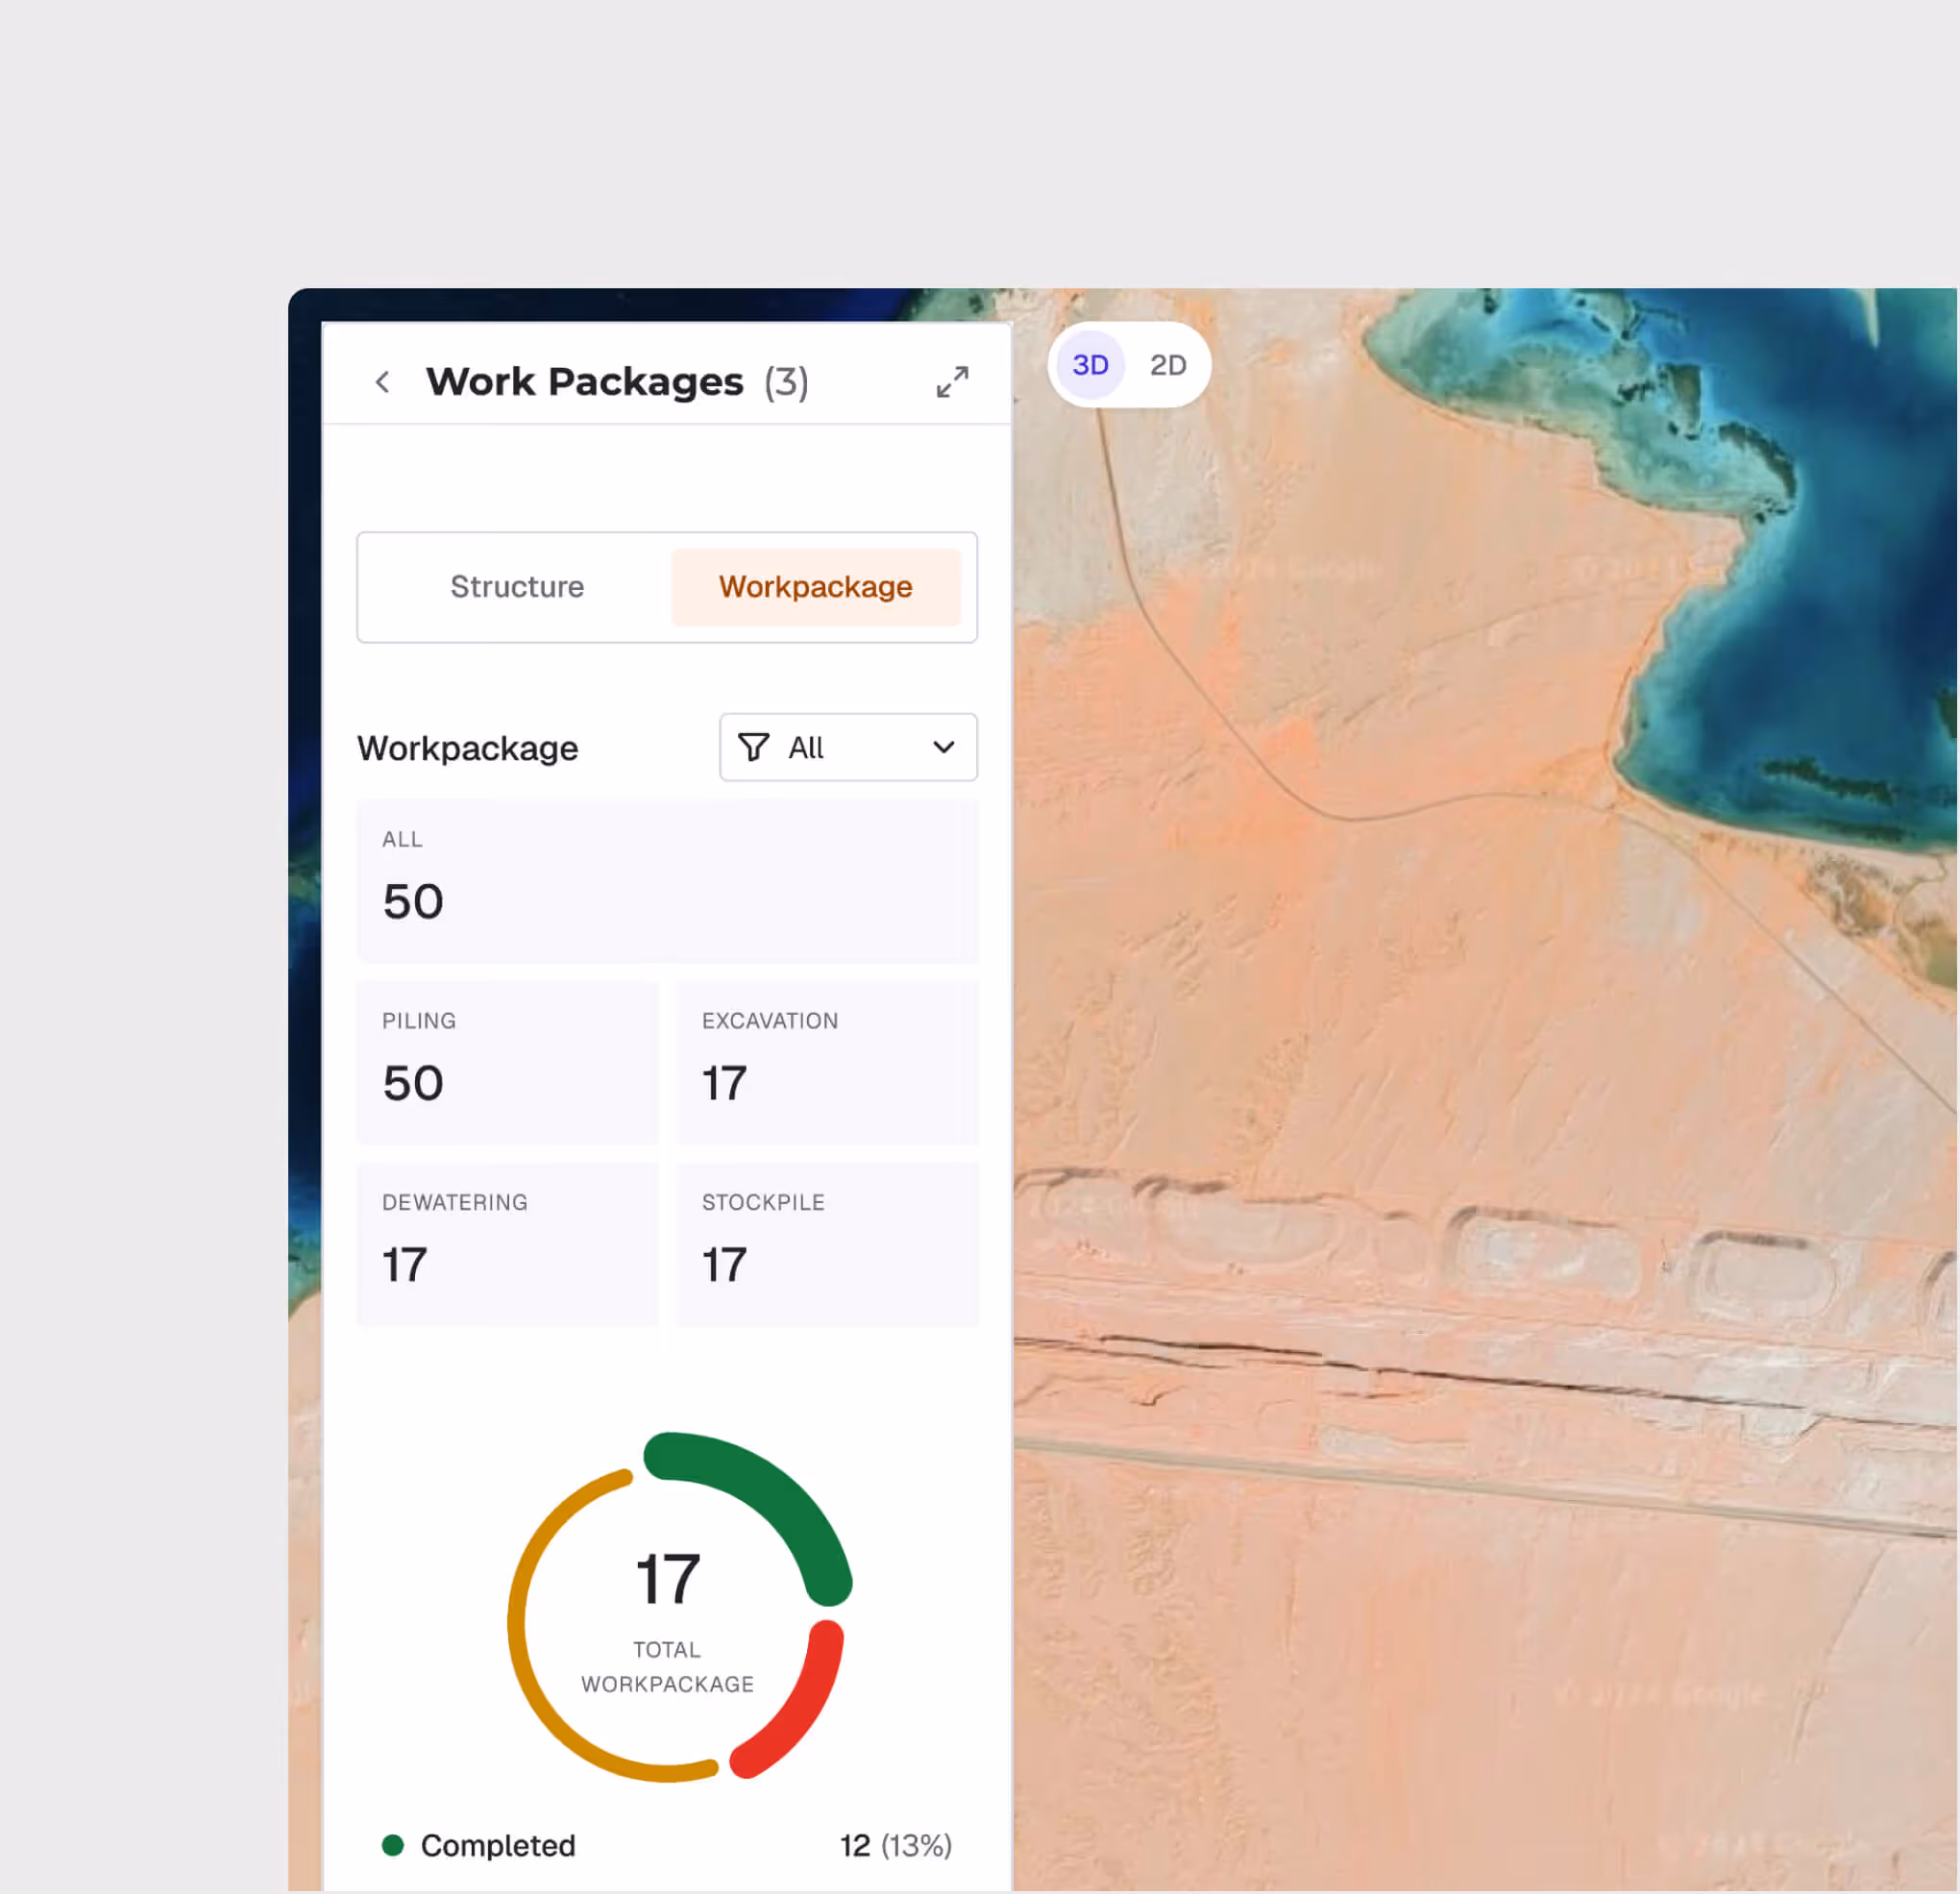
Work Package Tracking
Schedule Layer Integration
Polygon, Line, and Location Annotations
Construction Status Visualization
Side-by-Side Model Comparison

CAD & Geospatial Overlay
Import DWG, DXF, and KML files directly onto the interactive map with adjustable transparency.
Work Package Progress Mapping
Visualize work package completion with color-coded zones — planned, in-progress, and completed — all geolocated on your project map for instant status awareness.
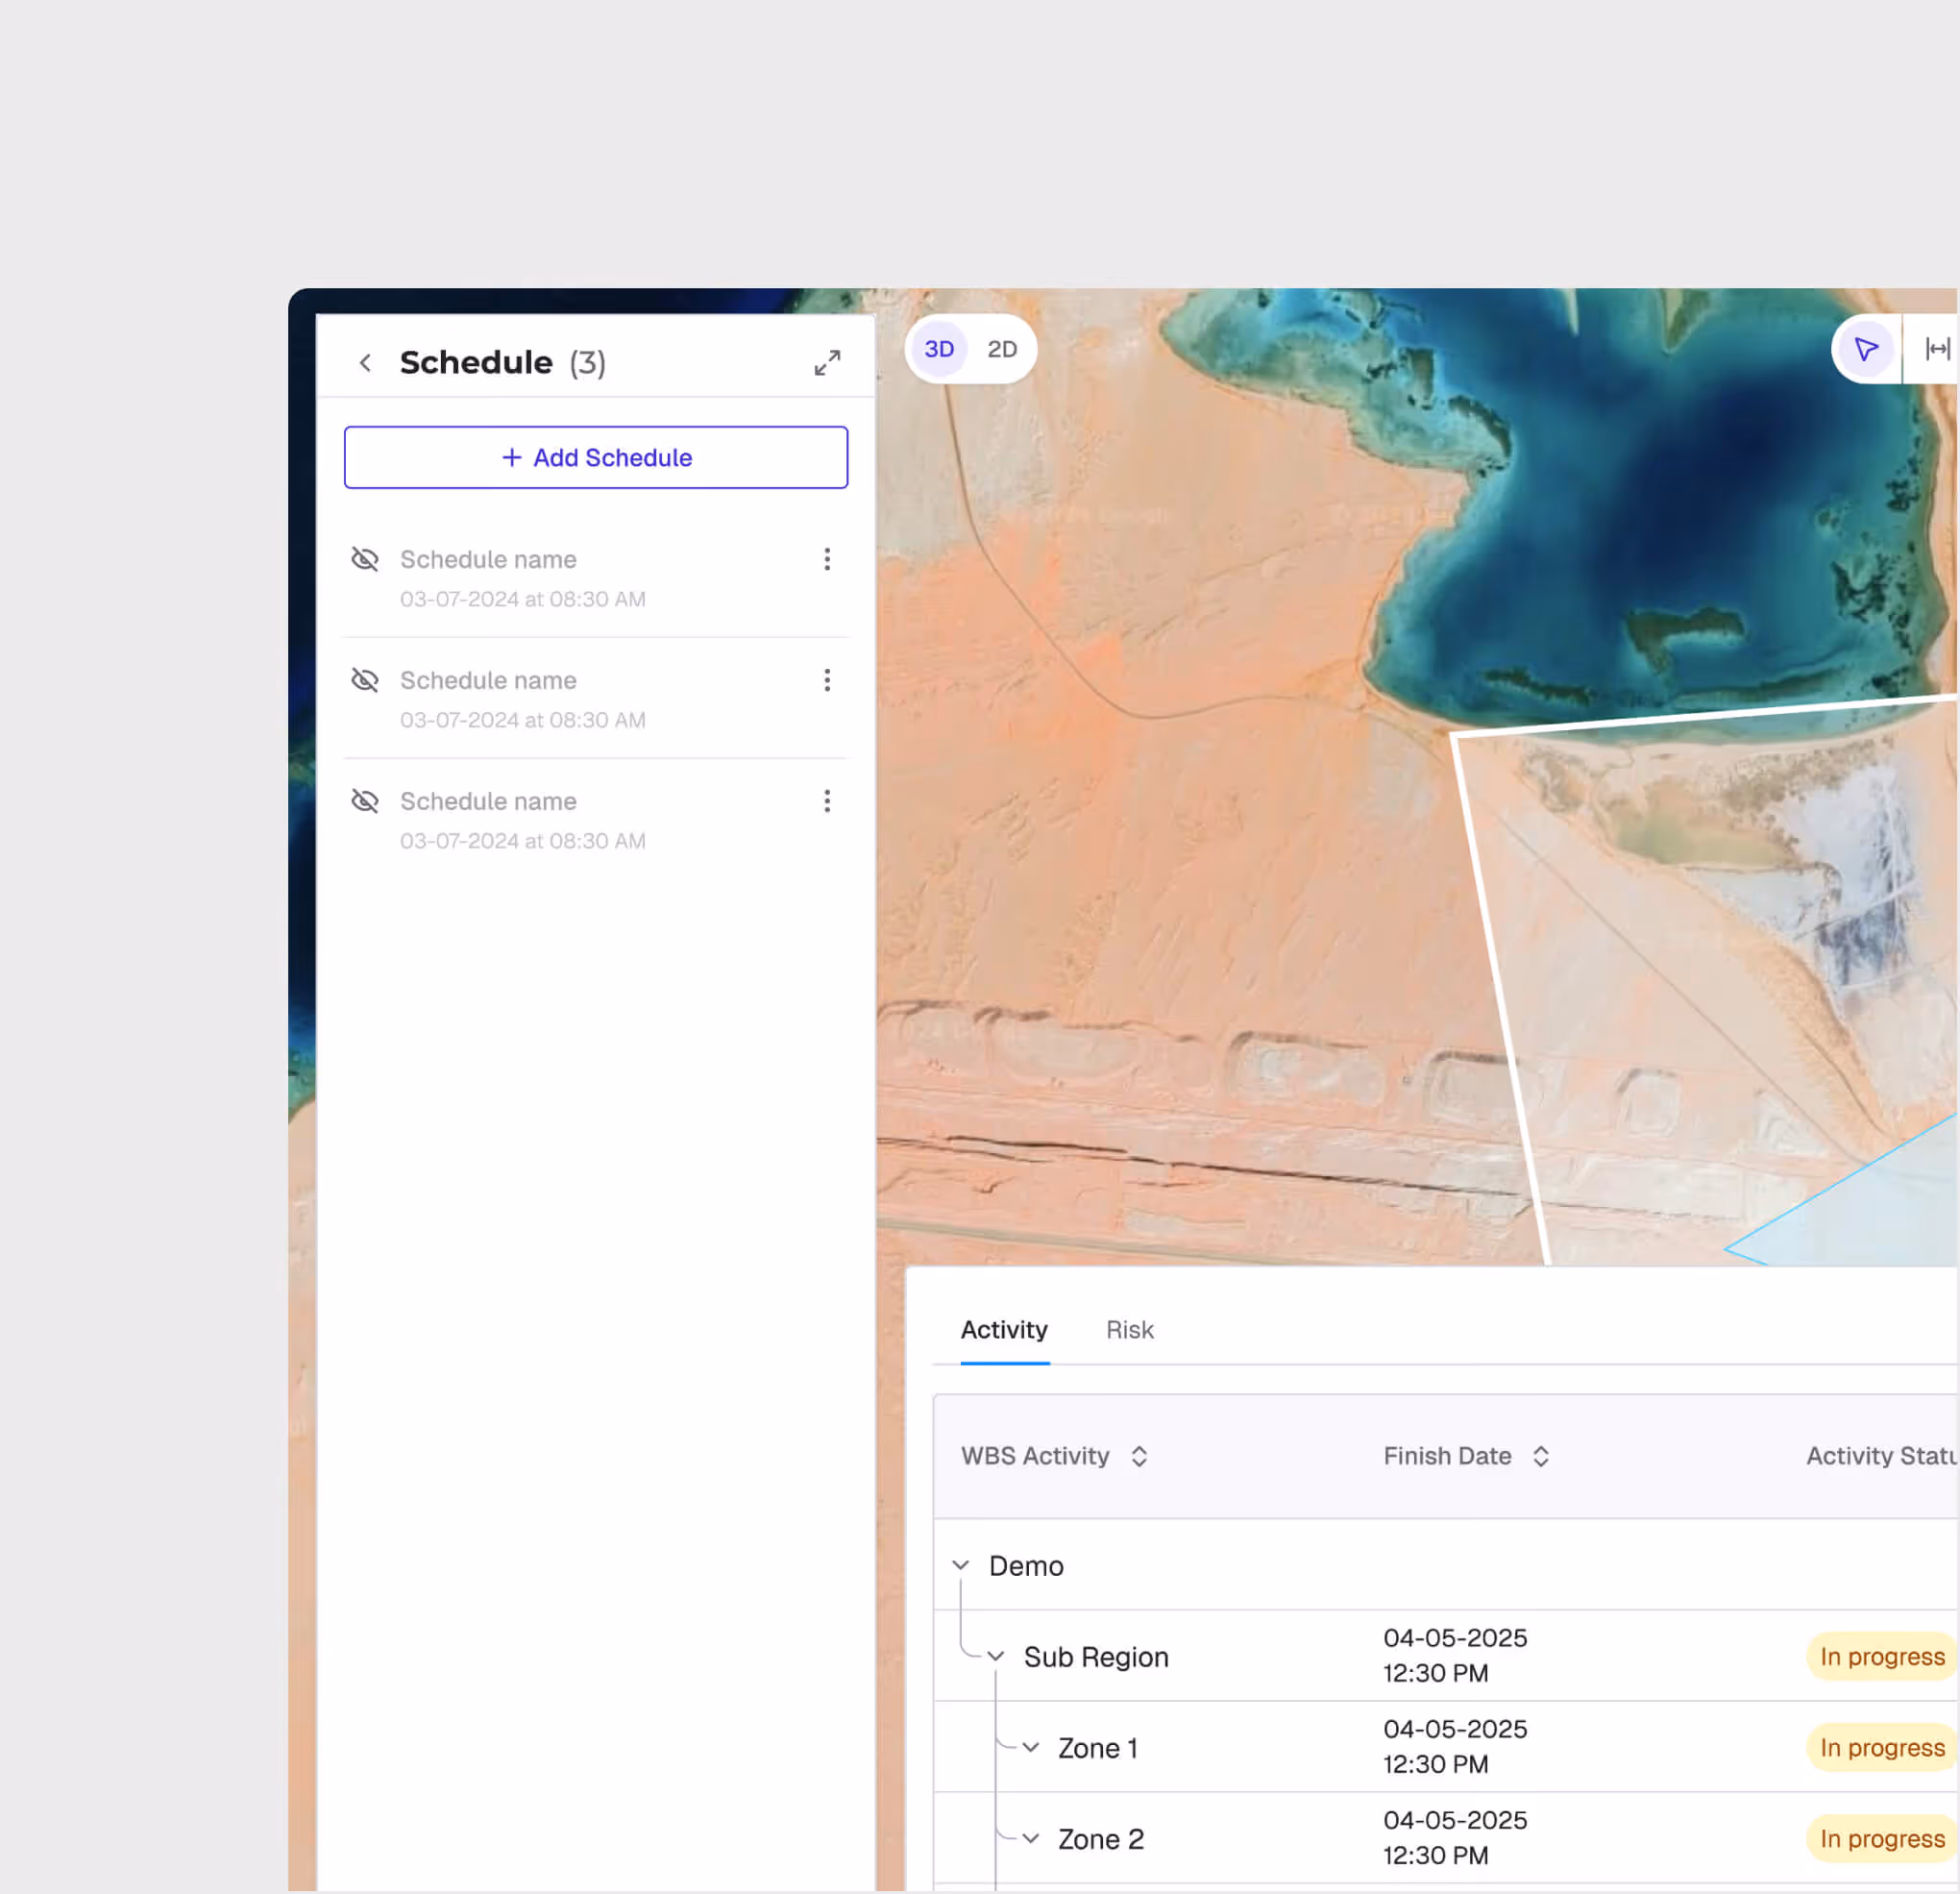
Schedule Integration with Primavera P6
Sync your Primavera P6 schedules directly into the map view. See activity start/end dates, completion percentages, and dependencies overlaid on the spatial layout.
Annotation & Measurement Tools
Draw polygons, lines, and points directly on the map with custom attributes. Use built-in measurement tools to calculate distances and areas for planning verification.
.avif)
.avif)
Roll Comparison View
Compare two model snapshots side by side using a drag divider to visually inspect changes between different time periods — catching deviations before they escalate.
GIS 2D is most useful for:
Project Managers
Full Project Visibility
Get a single-pane view of all project zones, schedules, and progress — eliminating the need to reconcile data from multiple disconnected tools.
Planning Engineers
Digital Zone Planning
Plan and visualize construction zones spatially, overlay design drawings against the masterplan, and verify measurements directly on the map.
Site Engineers
Field-To-Office Alignment
Access real-time construction status from any device, compare as-built progress against planned schedules, and annotate issues with geo-referenced precision.
"GIS 2D gave us a single screen to see everything — CAD overlays, schedule status, location data with metadata, and masterplans — all on one map. We cut our weekly planning meetings from 5 hours to 30 minutes and finally had a single source of truth."
.avif)
Frequently asked questions
Yes. All geo-tagged incidents are displayed on the GIS map, enabling spatial analysis of incident patterns and high-risk zone identification.
GIS 3D supports IFC and RVT for BIM models, LAS/LAZ for point clouds, and standard image formats for drone orthomosaics and aerial imagery.
Yes. GIS 2D and GIS 3D share the same geospatial foundation. You can switch between 2D planning views and 3D visualization views seamlessly.
When an incident is logged, the user selects the appropriate SOP-based workflow based on incident type and severity, guiding investigators through each required step.
WhiteHelmet products GIS 2D works well with

Field Intelligence
