
AI Visual Pollution
AI-powered environmental monitoring that detects visual pollution from images automatically.
Keep your Site Clean and Safe.
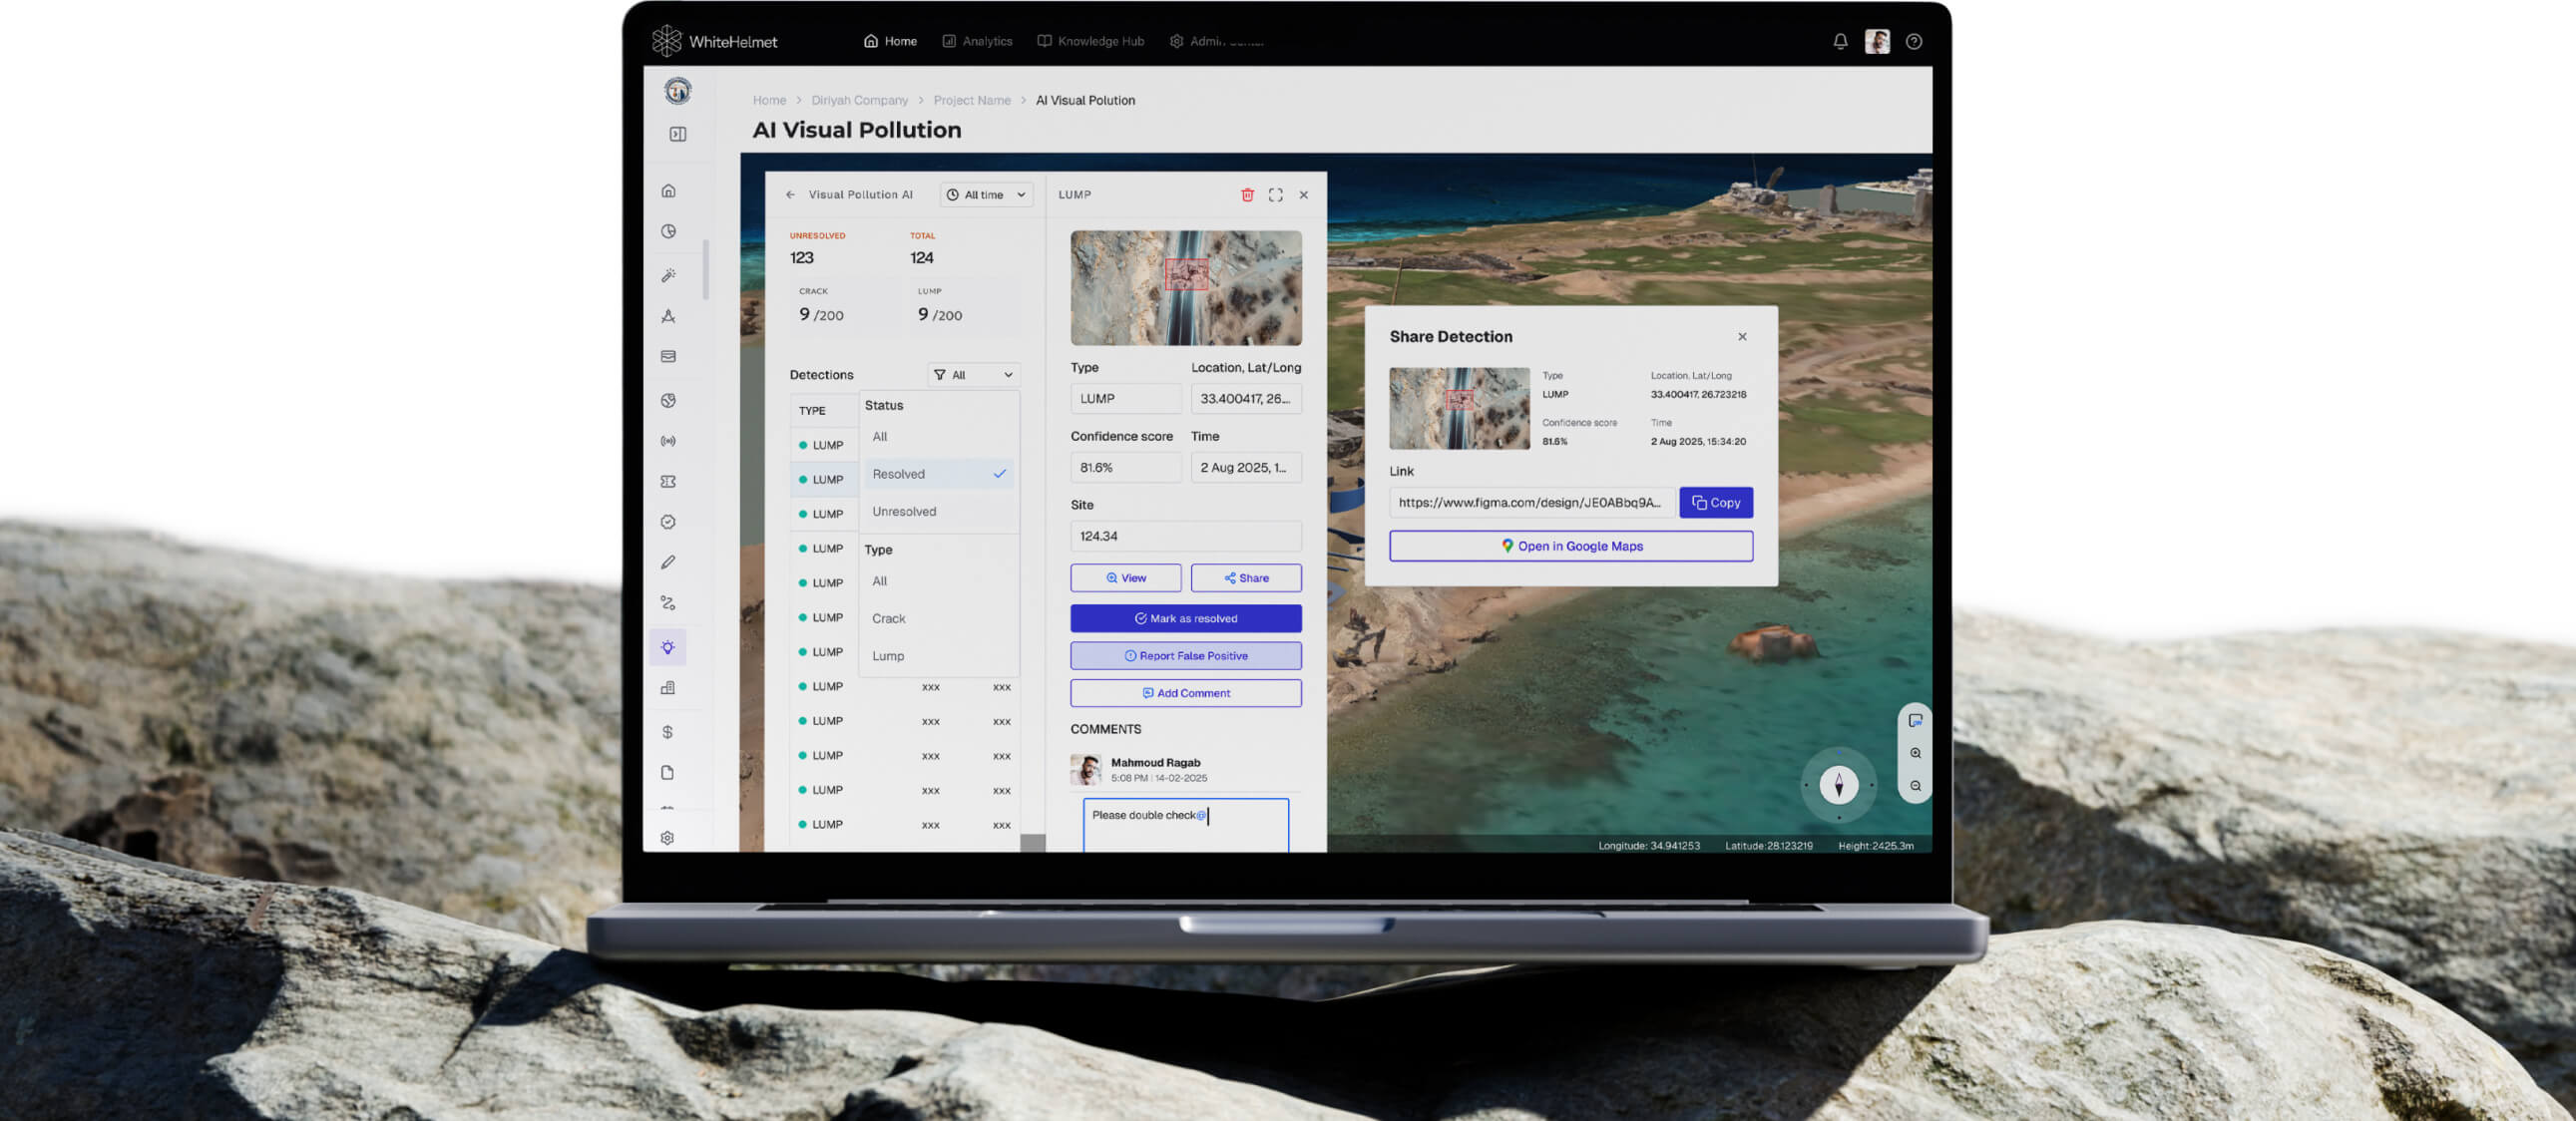
Upload drone images and let AI detect environmental pollution — waste accumulation, broken civil assets, stray animals, and construction waste. AI Visual Pollution frees manual site visit checks and allows you to optimize your resources based on real data, not randomized outsourcing.
AI Pollution Detection from Images
Multi-Category Violation Detection
Geo-Referenced Violation Mapping
Comment, Resolve, and Issue Detections
Trend Analytics & Dashboard
AI Detection Engine
Upload drone images and the AI automatically identify pollution types — waste, broken civil assets, stray animals, and construction waste — with confidence scores and bounding boxes.
Multi-Category Detection
The system recognizes multiple pollution categories simultaneously, classifying each detection by type, severity, and geolocation.
.avif)
.avif)
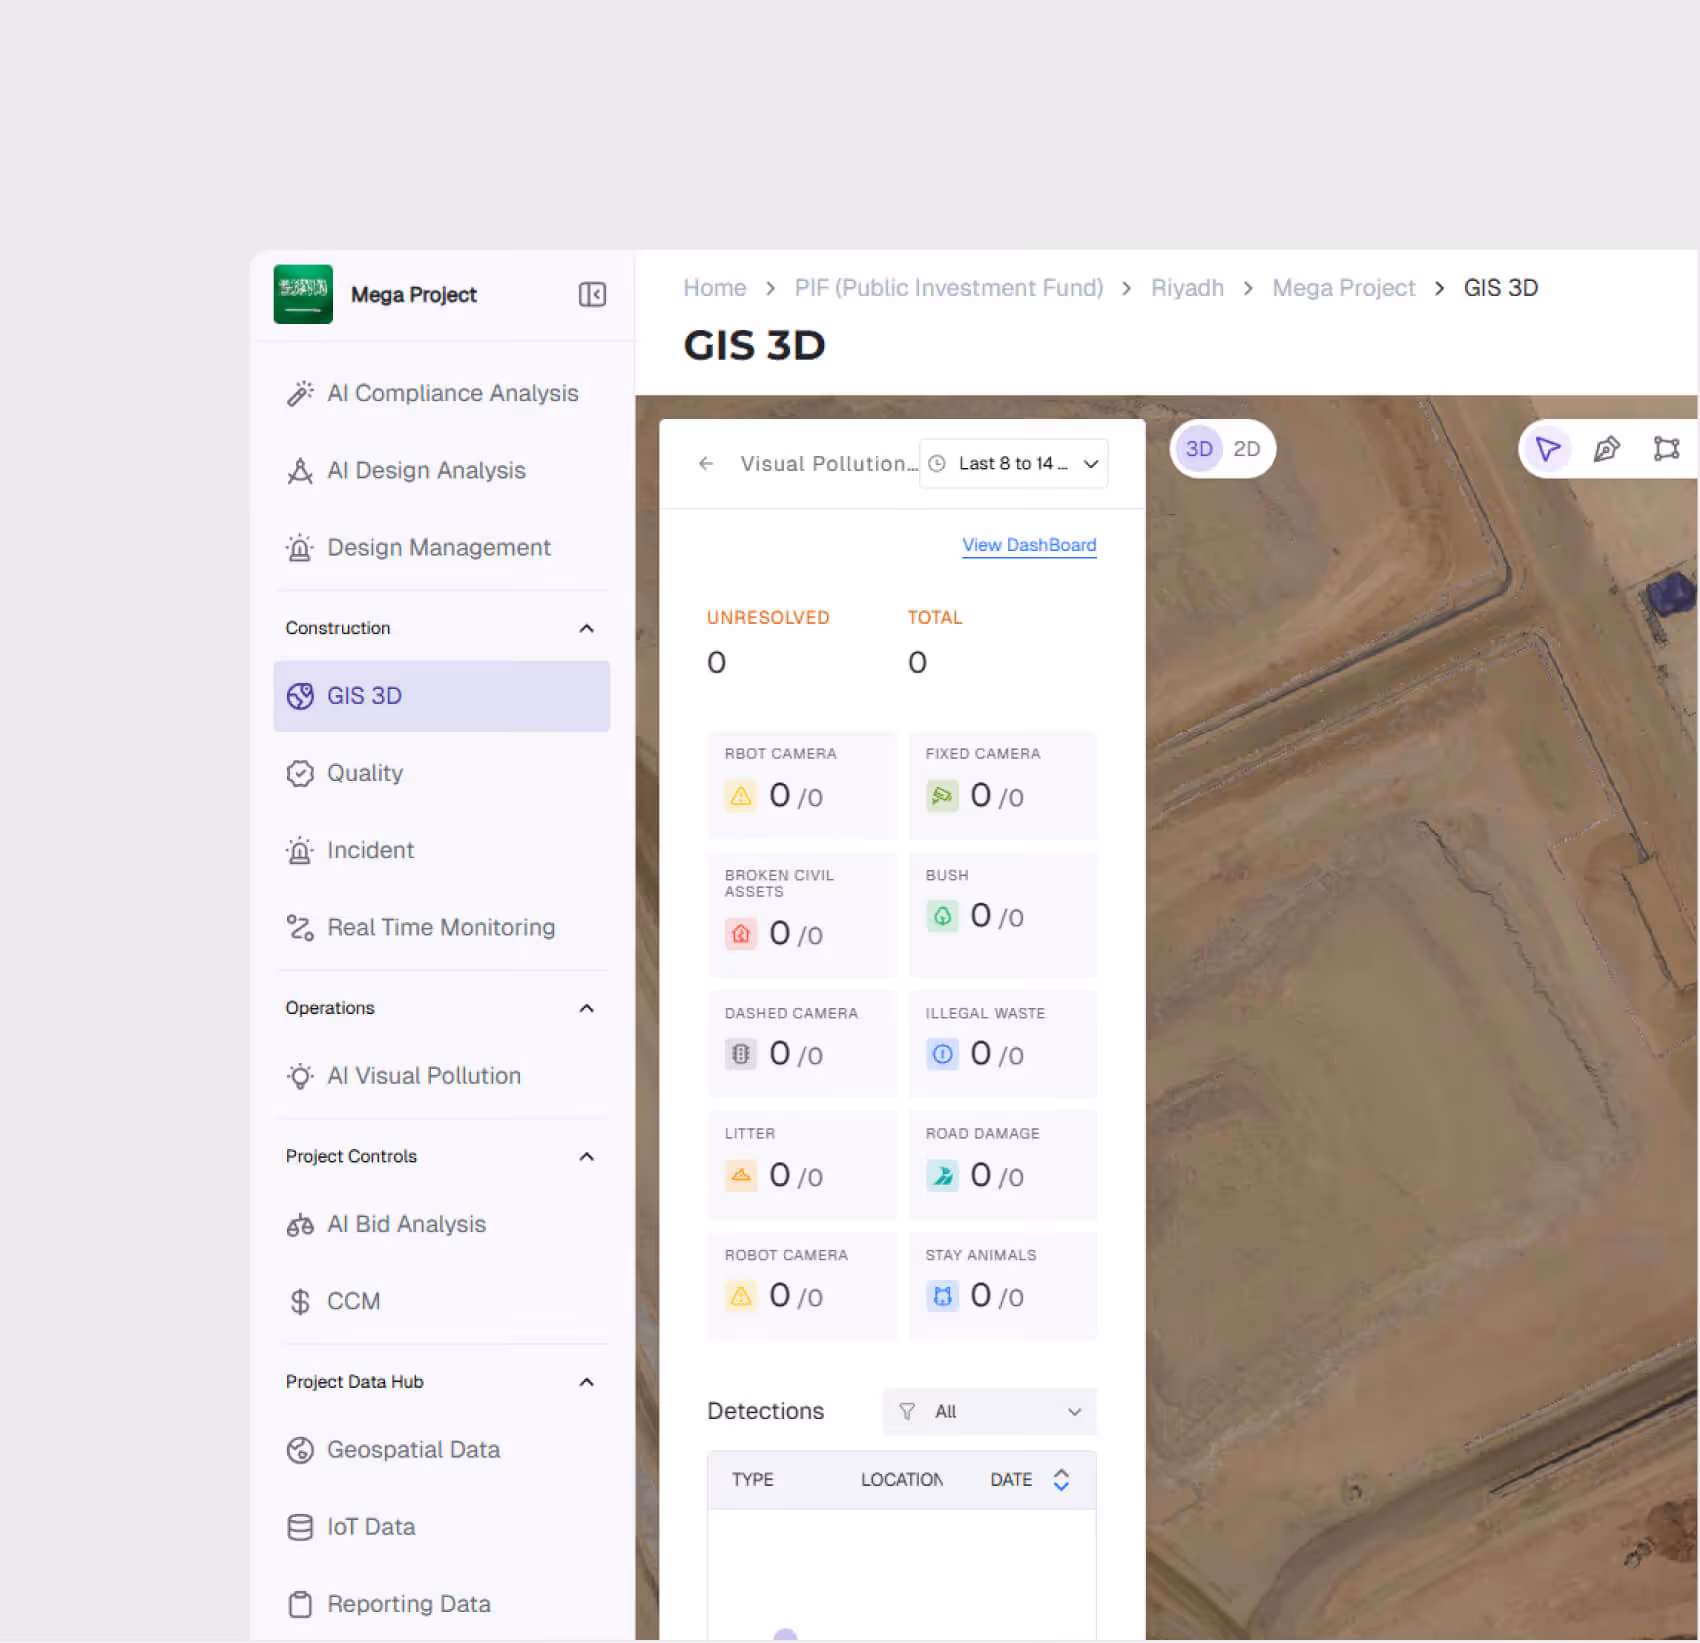
Geo-Referenced Violation Mapping
Detections are mapped to their spatial location on the project GIS, enabling zone-level environmental monitoring and hotspot identification.
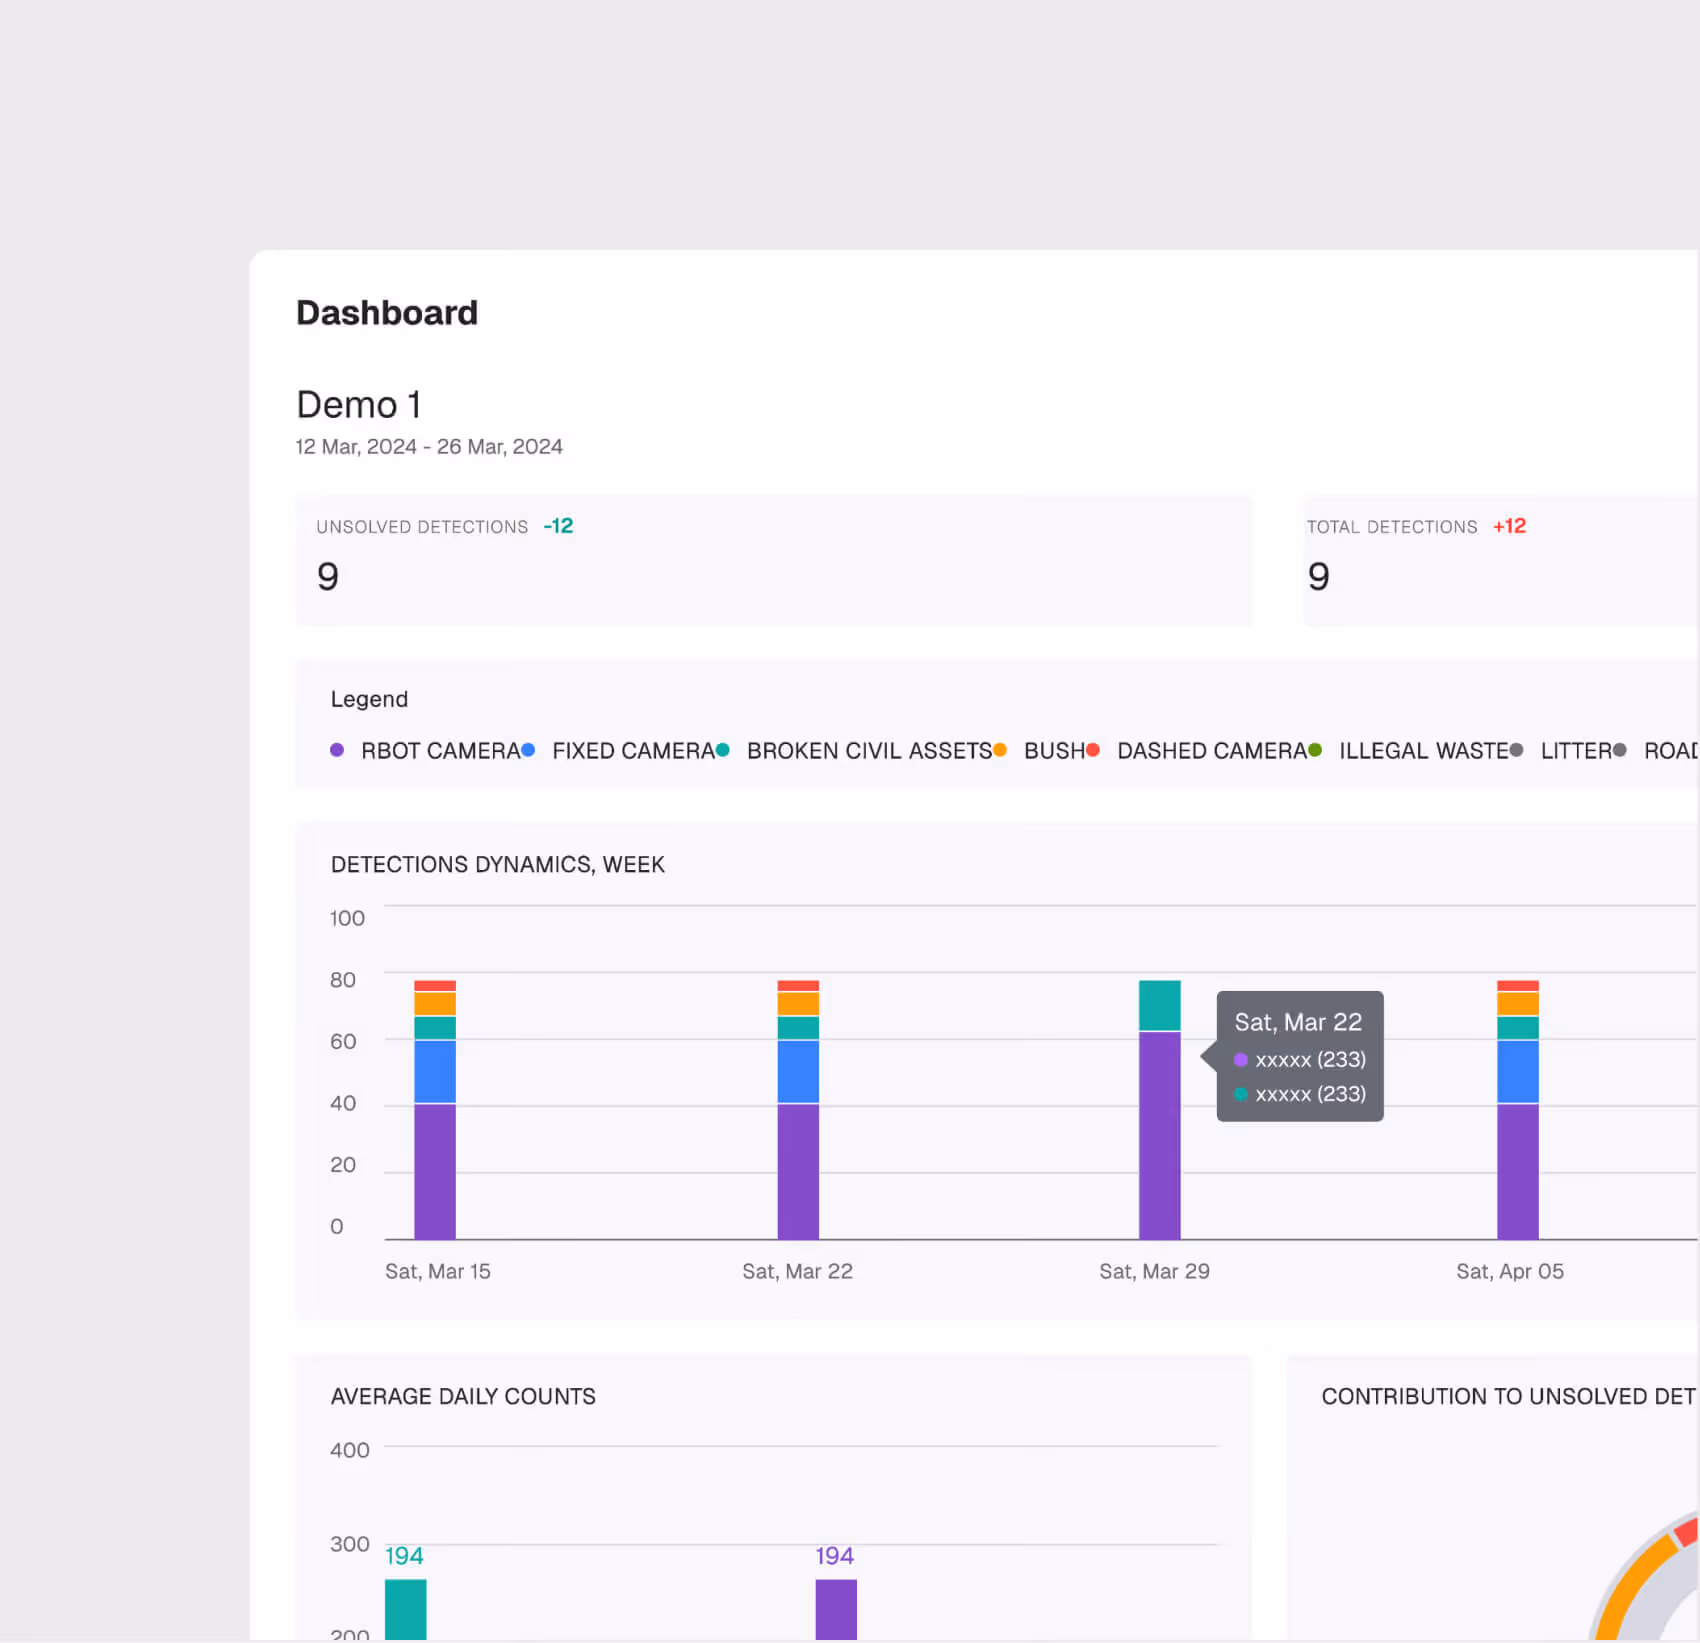
Compliance Trend Analytics
Track pollution detection trends over time — frequency, types, zones, and resolution rates — to demonstrate environmental due diligence to regulators.
AI Visual Pollution is most useful for:
Environmental Officers
Automated Compliance Monitoring
Replace manual environmental inspections with AI-powered image analysis that monitors site conditions continuously and flags violations before they escalate.
Municipality Supervisors
Proactive Site Management
Get early warning of environmental issues that could trigger regulatory stop-work orders, allowing corrective action before inspectors arrive.
HSE Directors
Portfolio Environmental Oversight
Monitor environmental compliance across all project sites from a single dashboard, with trend data for management reporting and regulatory submissions.
"We used to deploy 14 drivers across 30 locations for site visits and manual identification of visual pollution. Now we deploy 1 pilot across 30 locations and know exactly where to focus our efforts."
.avif)
Frequently asked questions
Yes. Export individual observations or bulk reports in PDF and Excel formats with full details, photos, and resolution history.
Yes. SOPs and checklists are fully configurable by project, work package, and trade. Add mandatory steps, required evidence types, and approval workflows.
The mobile interface supports field observation entry. Observations sync automatically when connectivity is restored.
The system supports customizable categories including safety, quality, environmental, housekeeping, and project-specific categories defined by your team.
Yes. Export observation logs as PDF or Excel, and generate analytics on observation patterns, team response performance, and visual progress history.
Observations can be pinned directly to a location within a 360 capture, giving assignees immediate visual context when reviewing or resolving an issue.

