
AI Data Analysis
AI-powered dashboards that turn raw project data into visual insights through conversation.
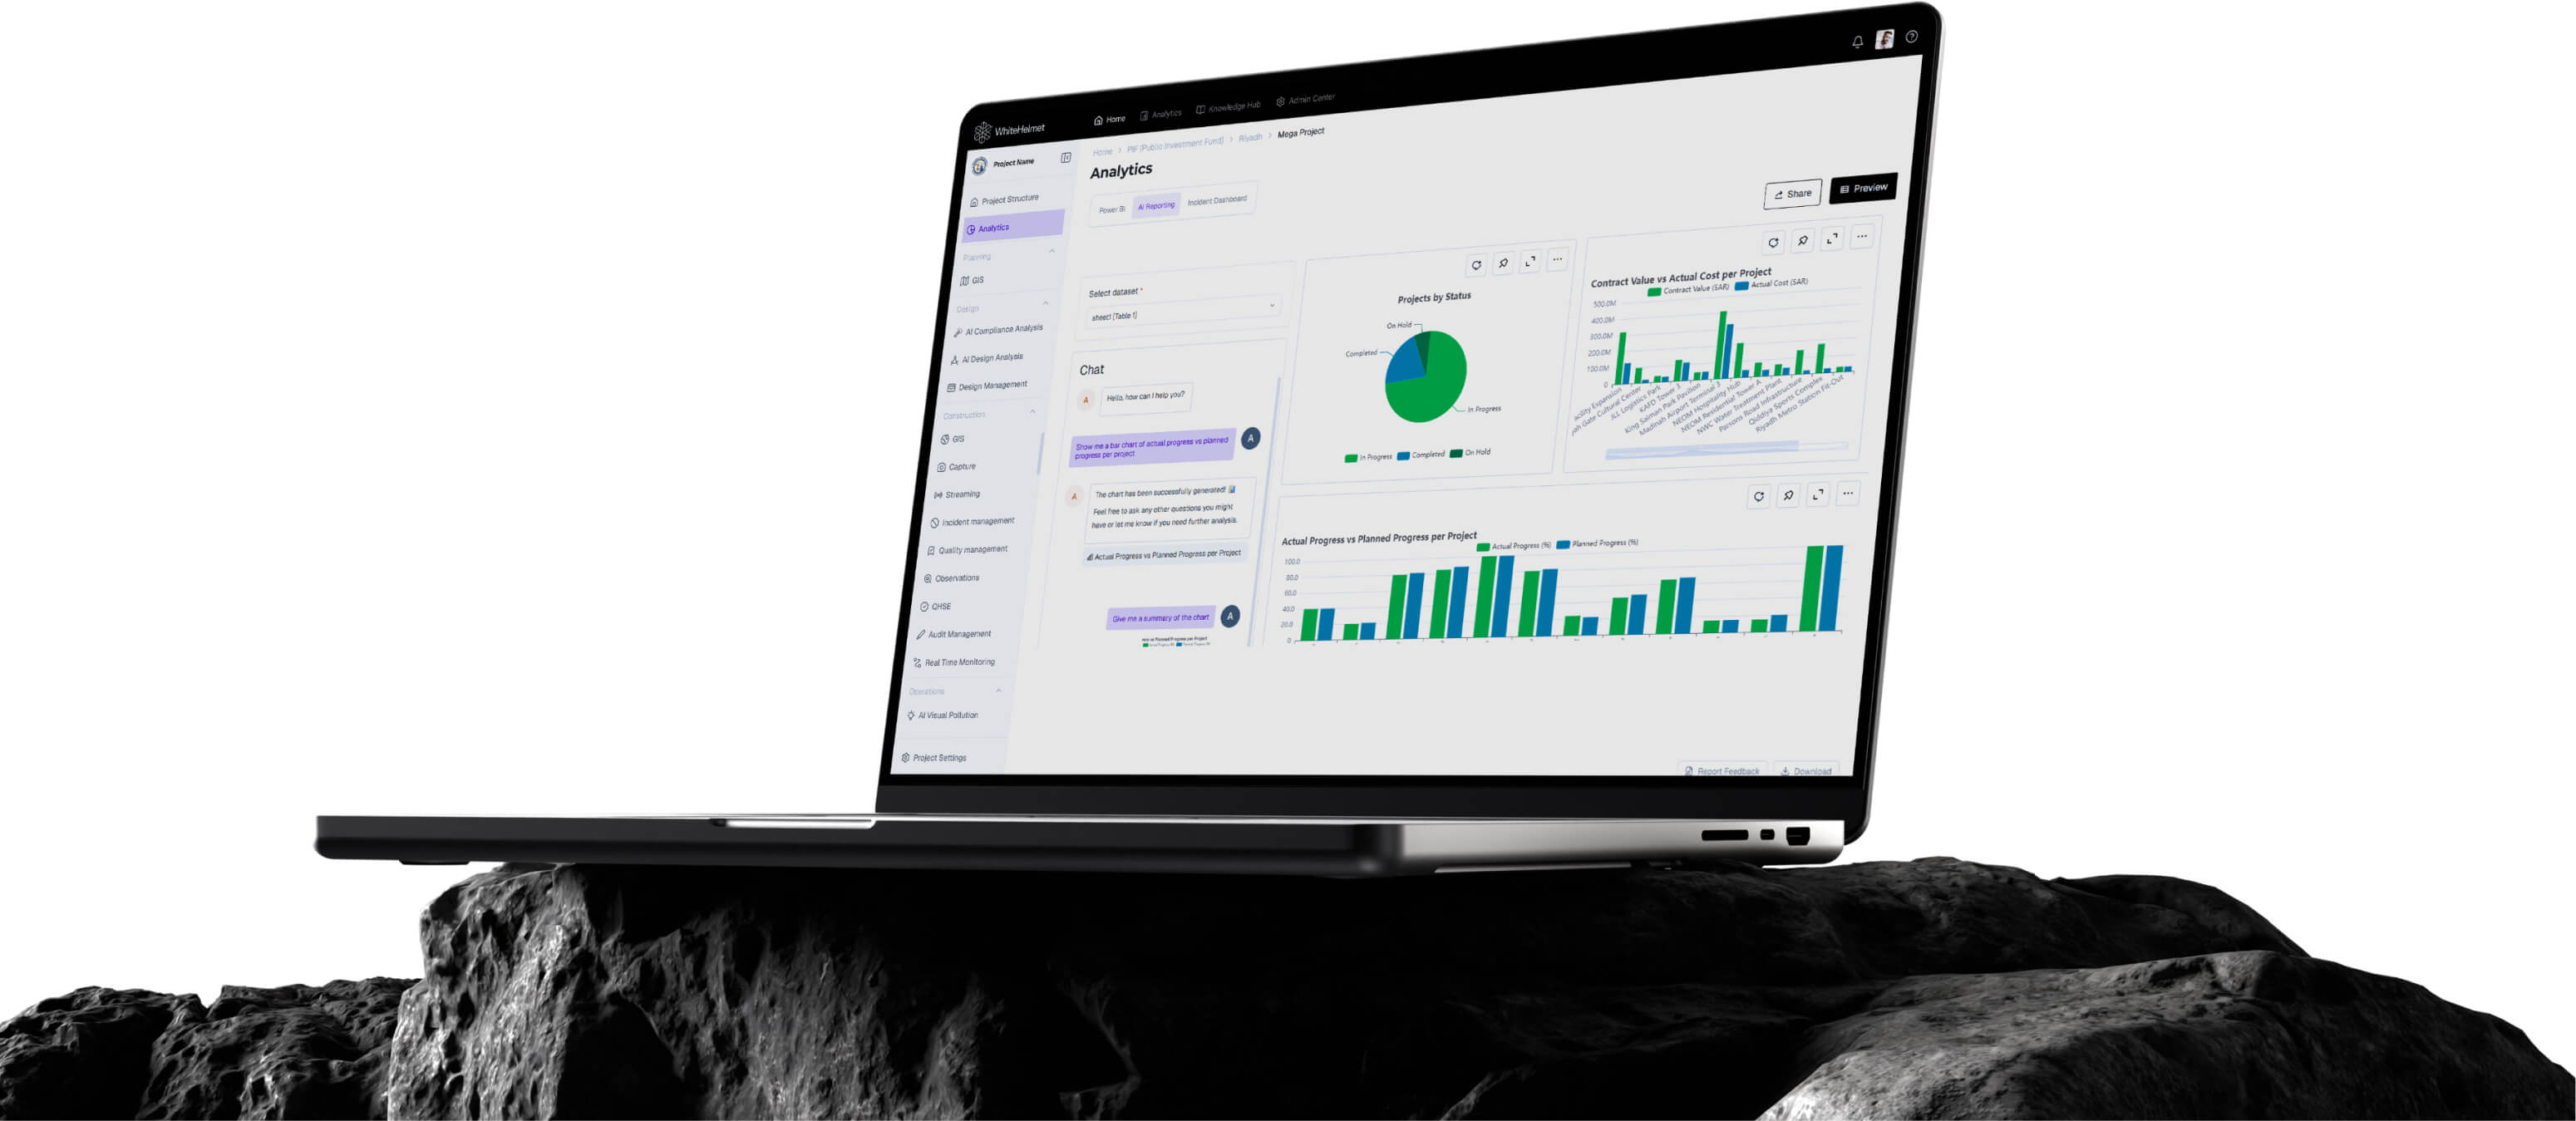
Talk to Your Data. Make Decisions Faster.
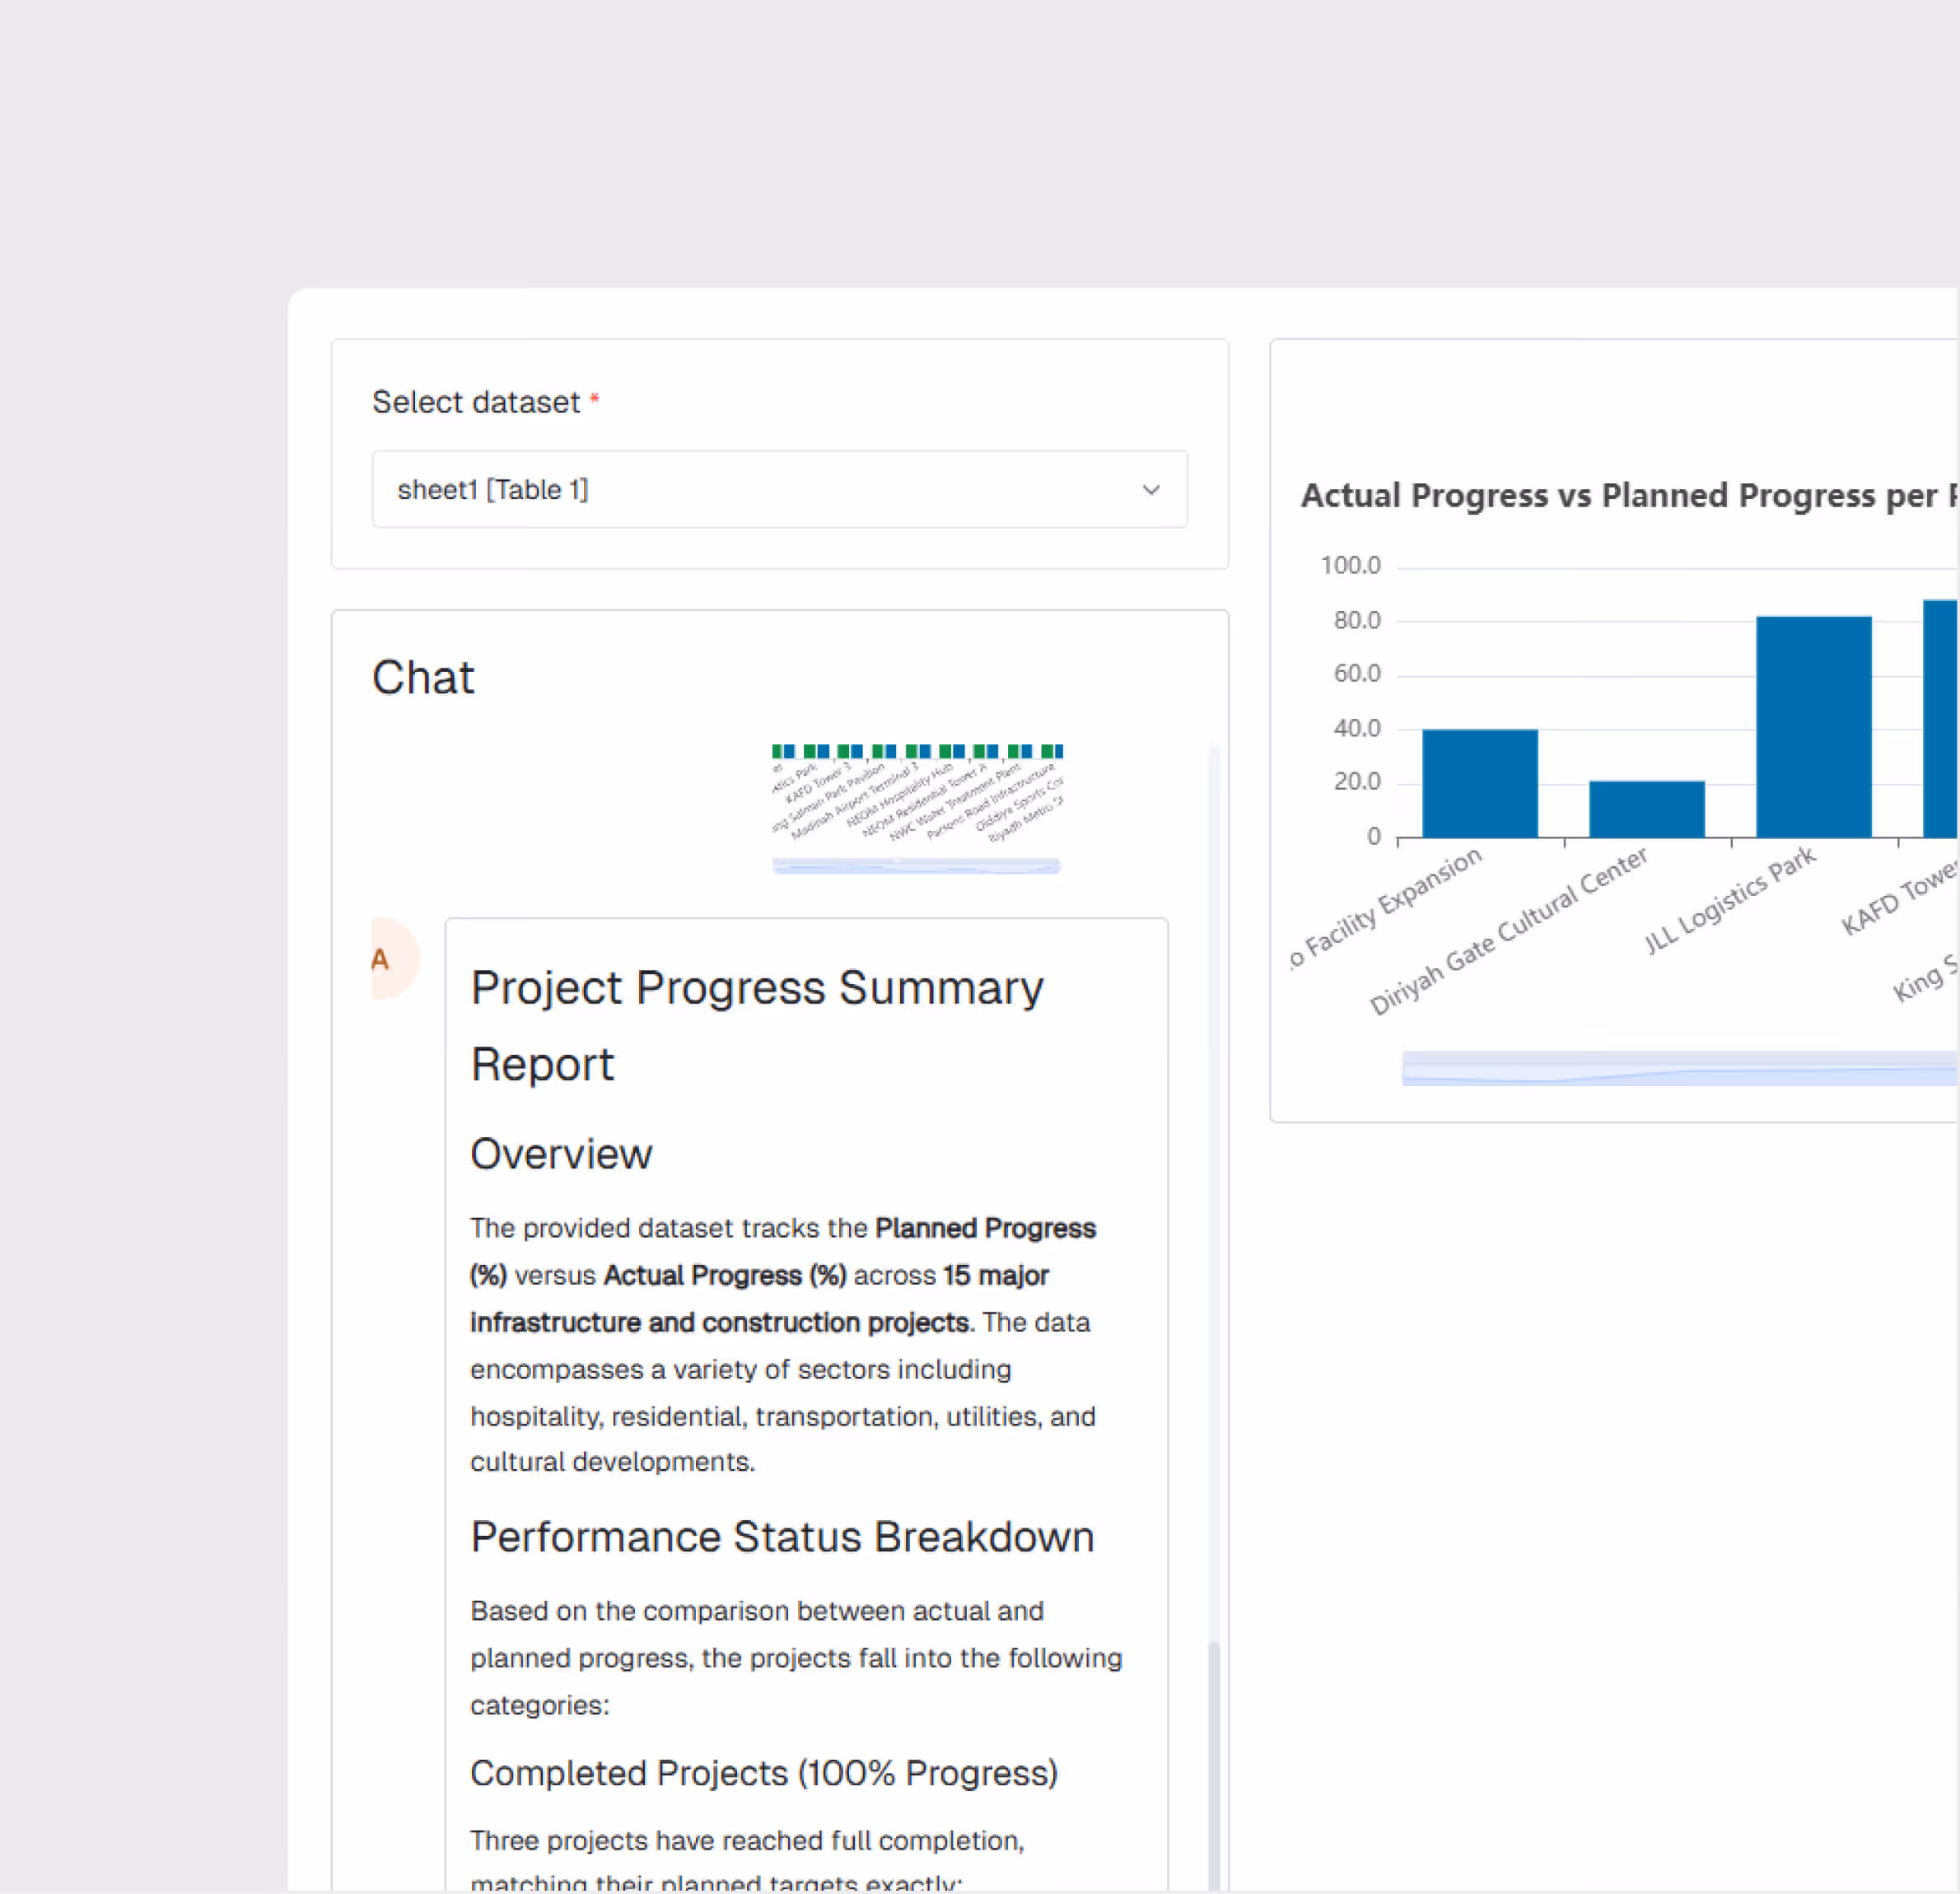
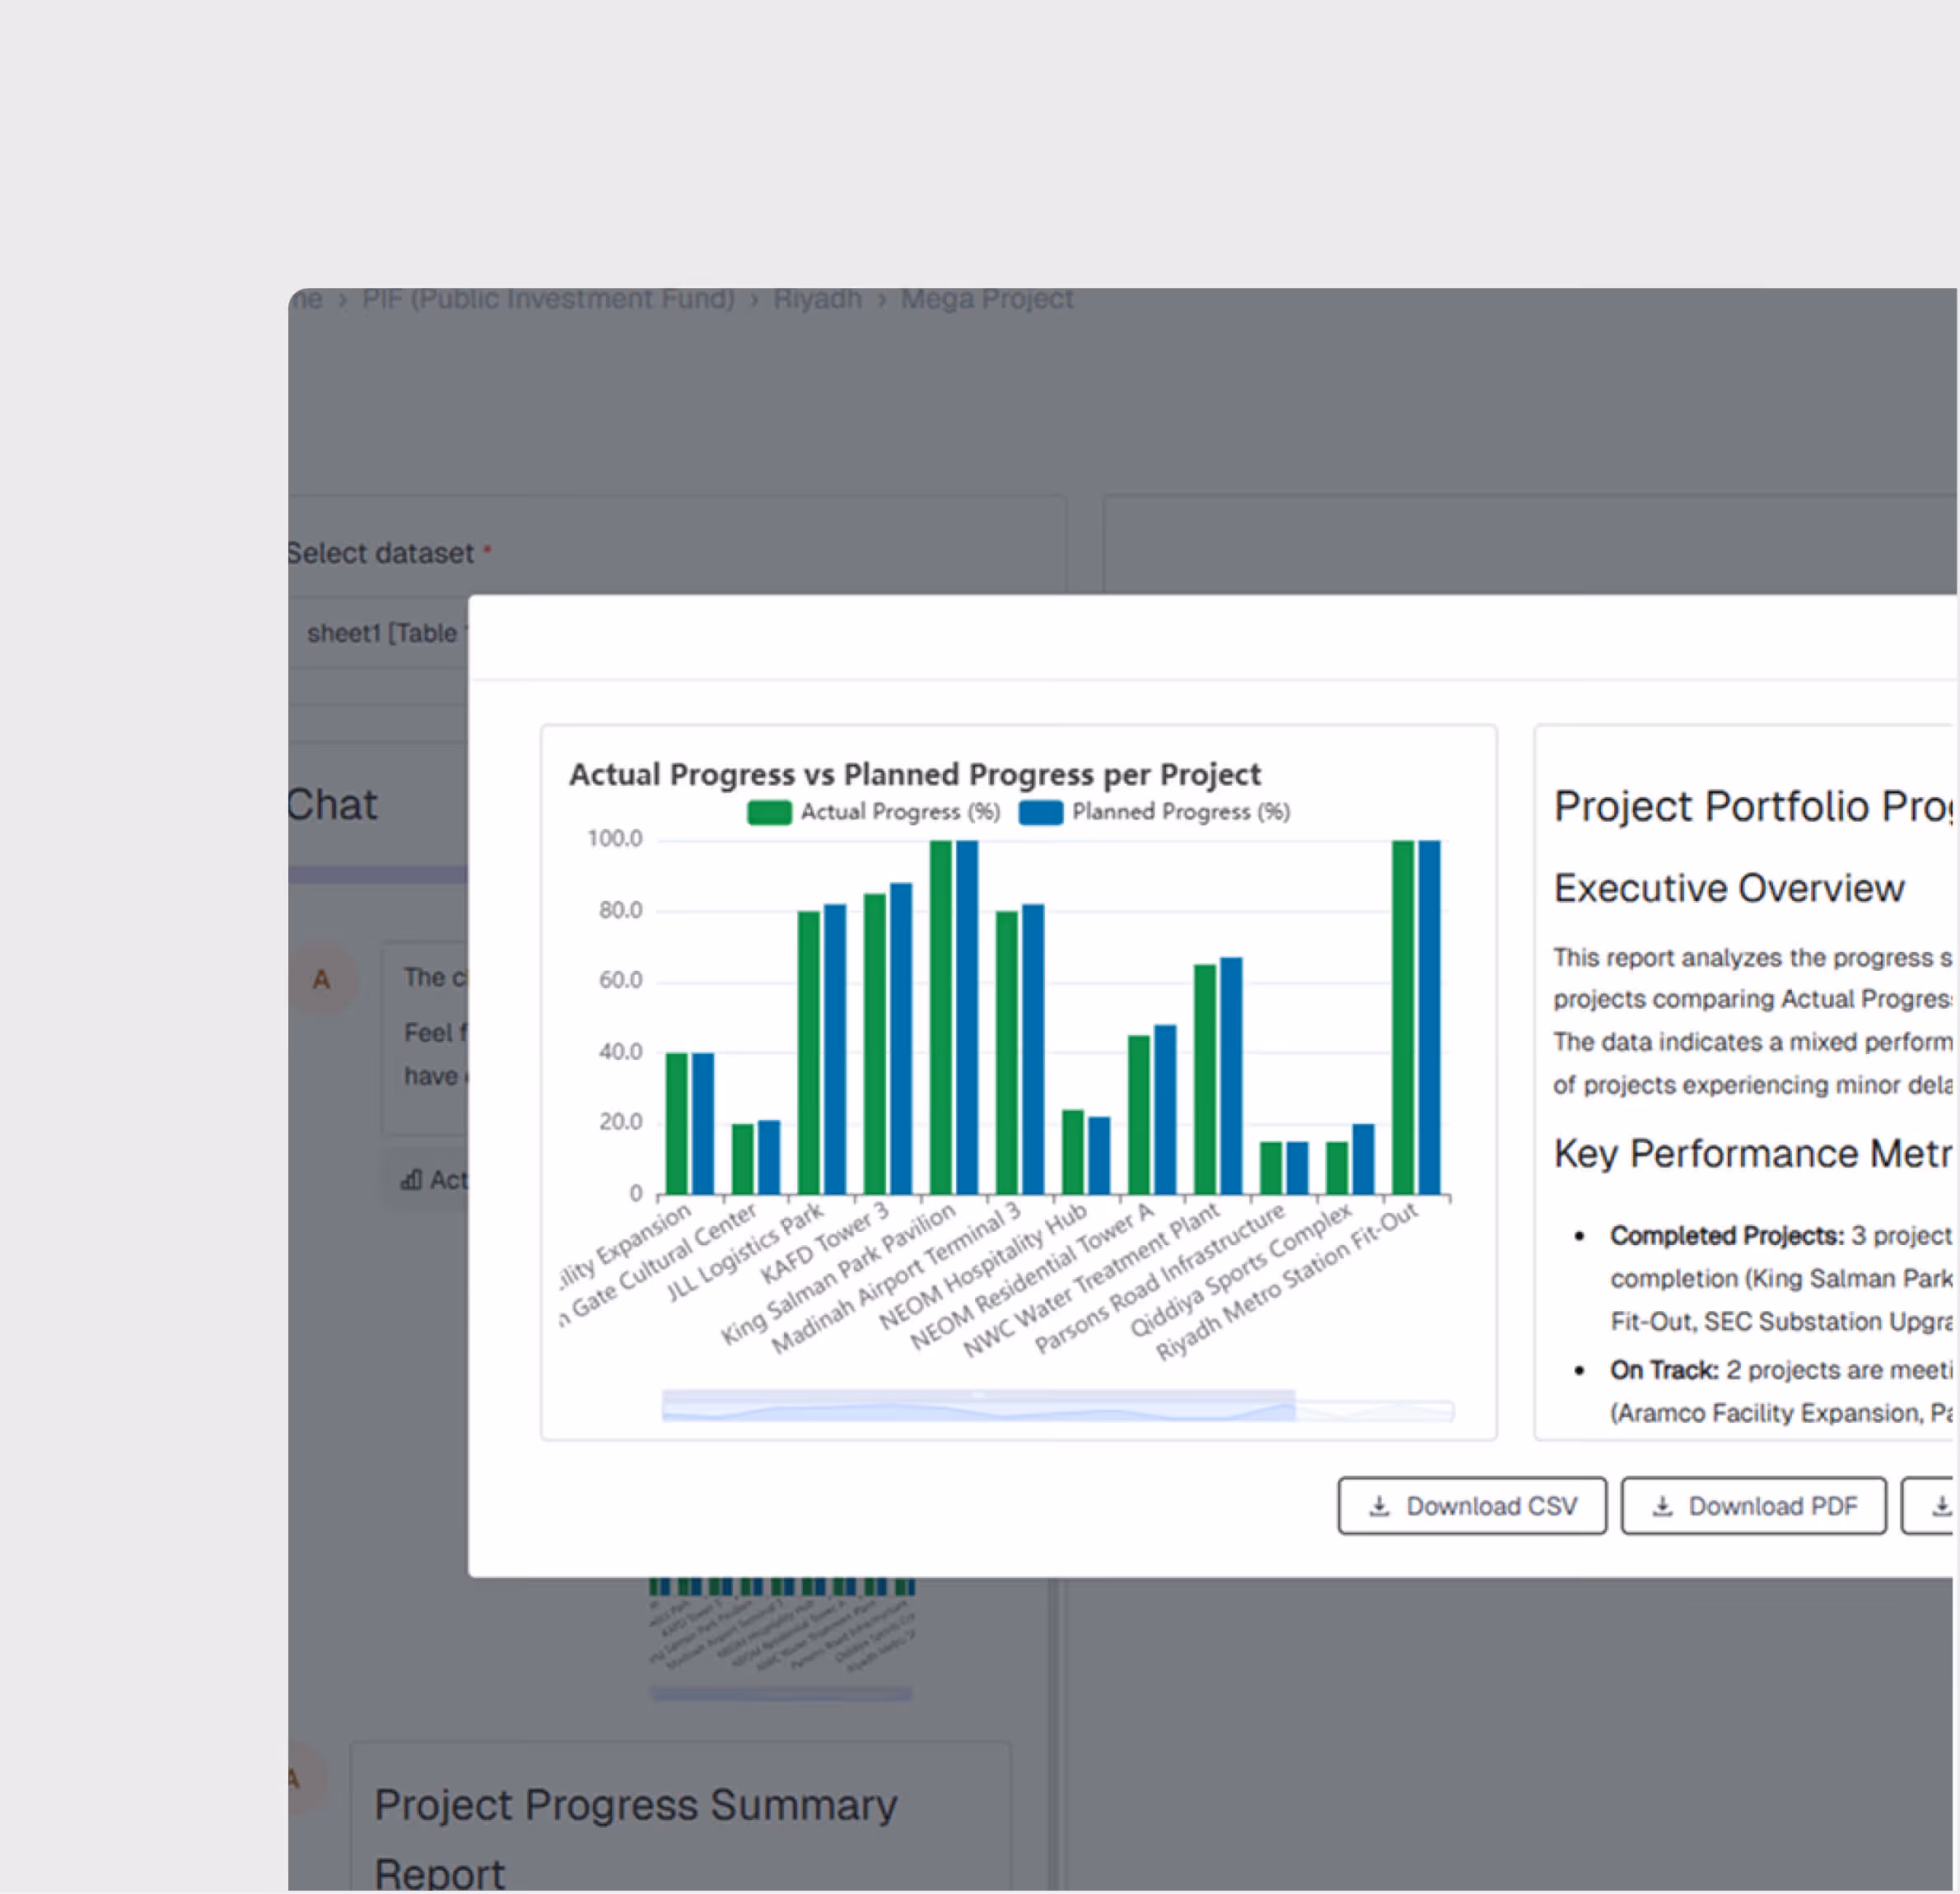
Upload project data or connect existing sources, then ask questions in natural language. AI Data Analysis generates interactive dashboards, charts, and insights automatically — think PowerBI on Steroids without having to learn PowerBI.
Conversational Data Analysis
Auto-Generated Dashboards
Excel & CSV Data Upload
Interactive Visualization
Exportable Reports
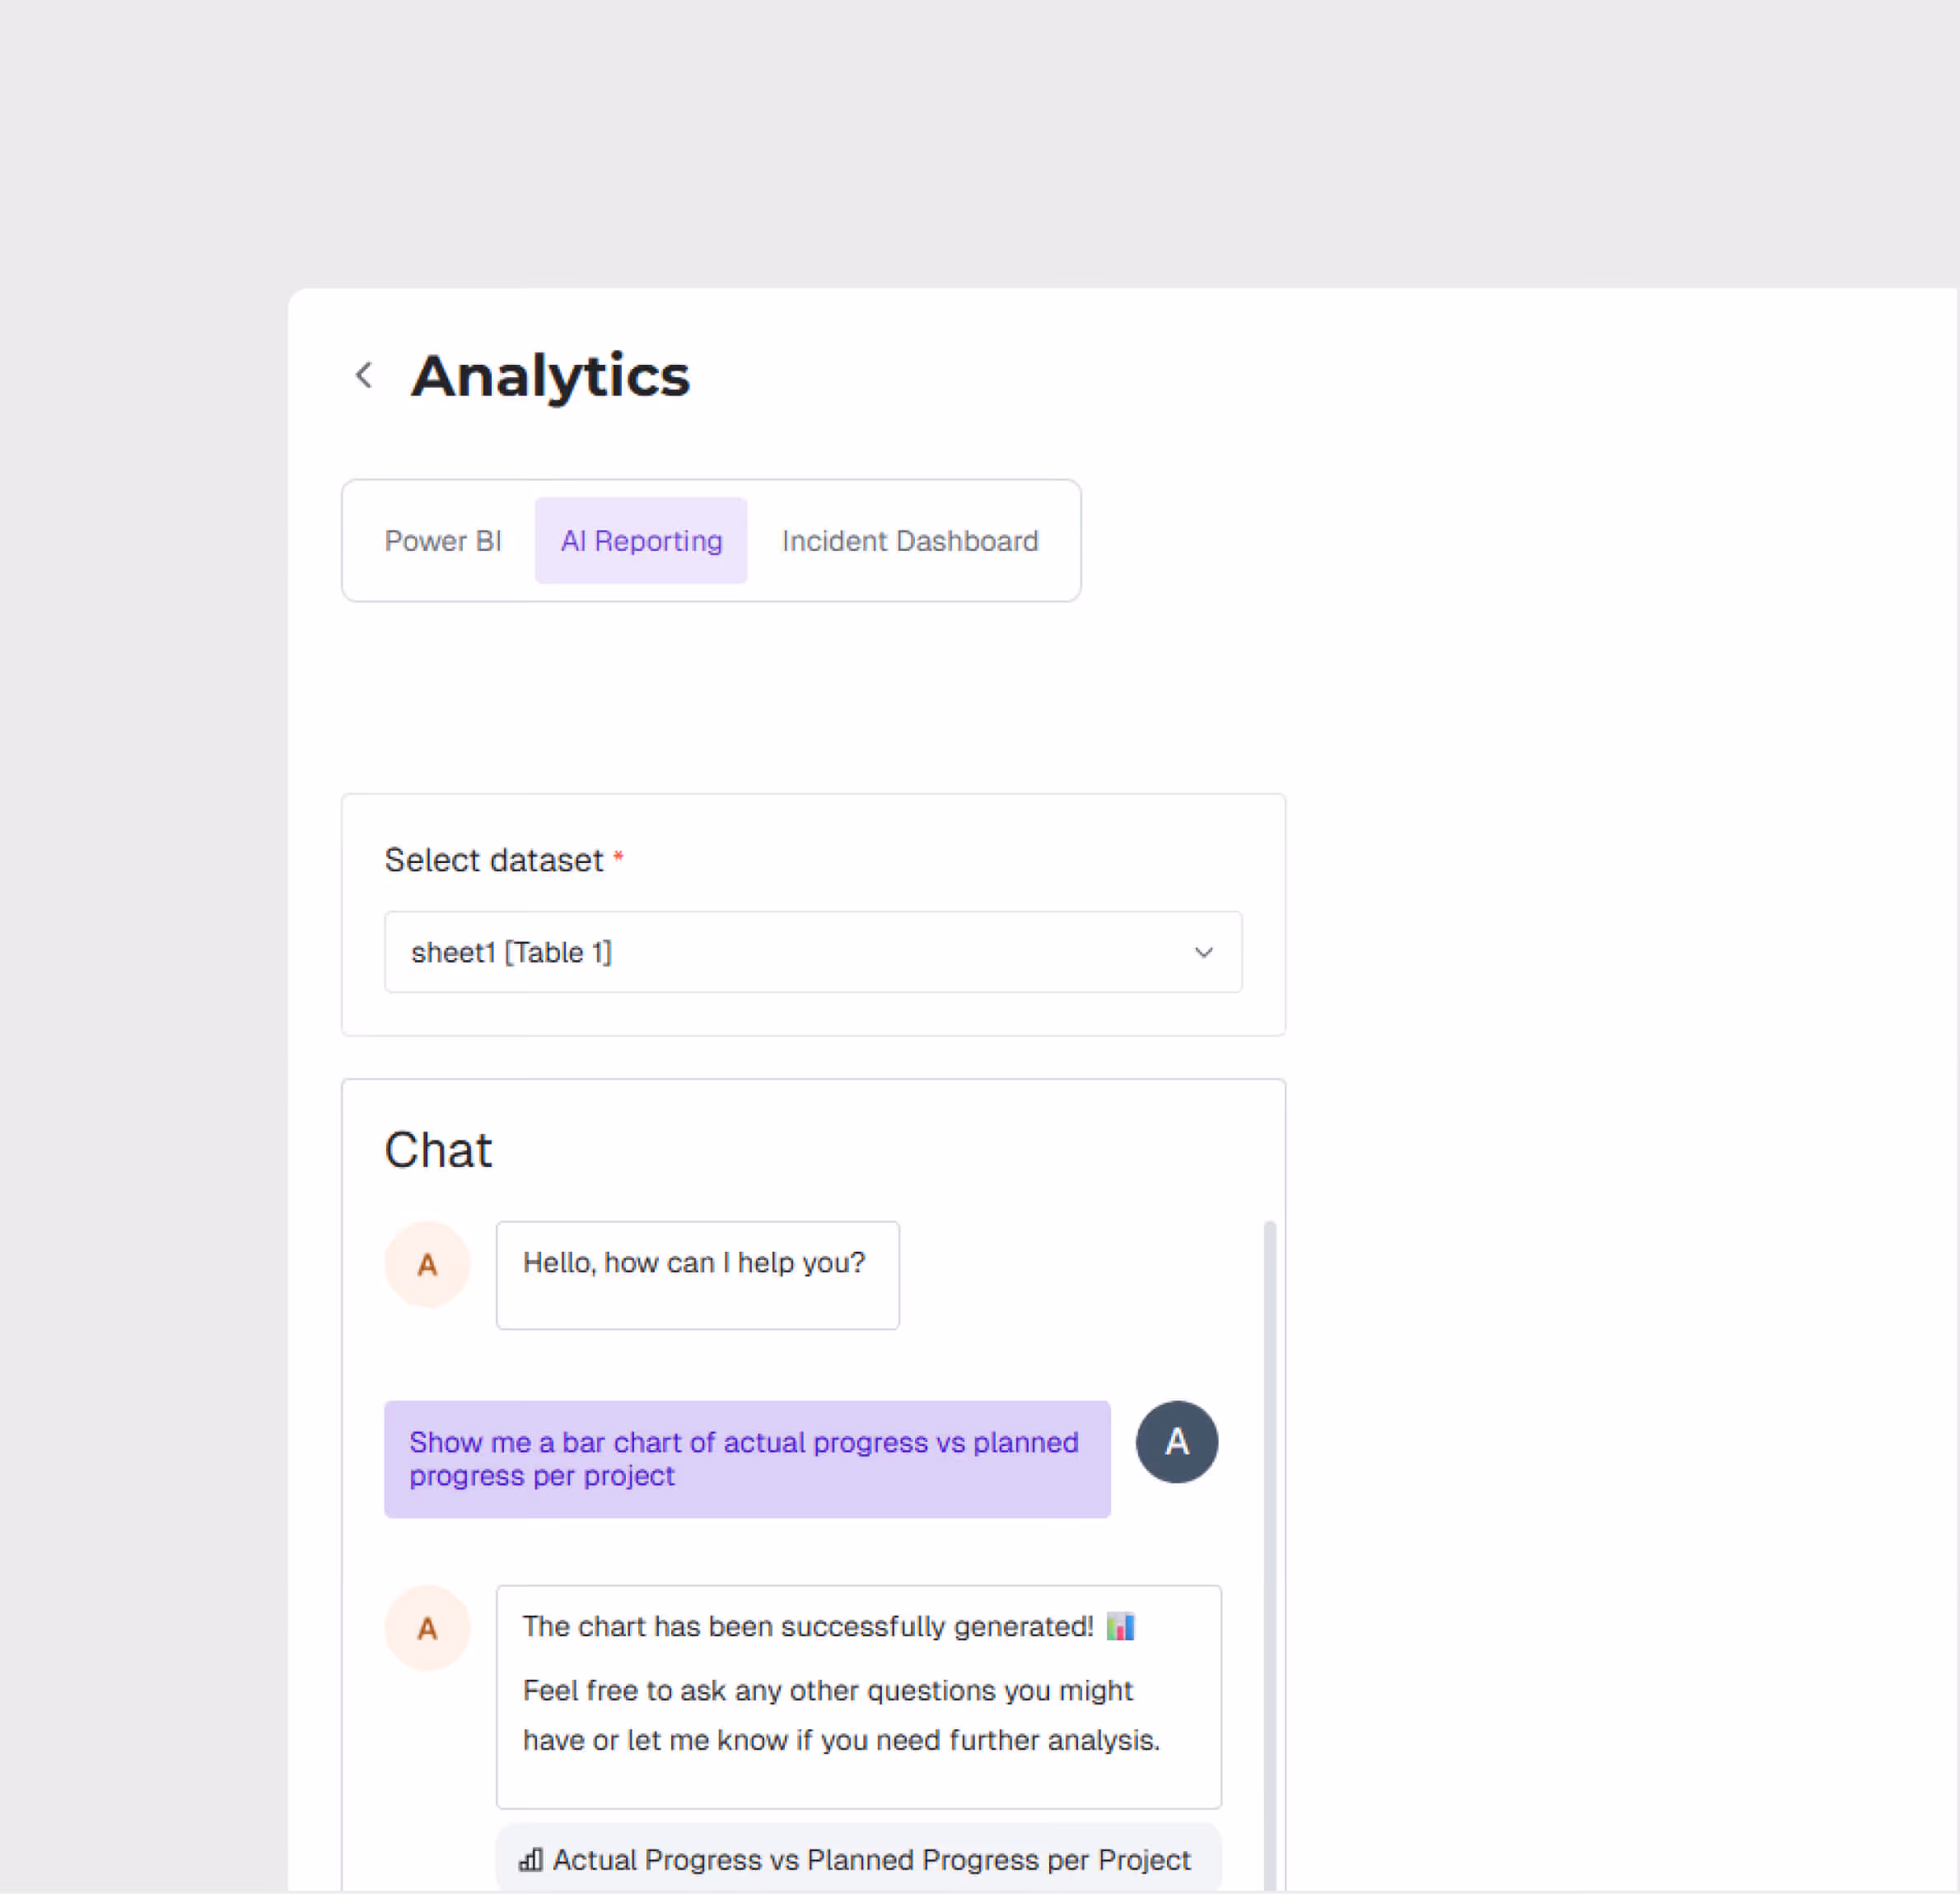
Conversational AI Interface
Ask data questions in natural language — 'show me monthly progress by contractor or what is the correlation of injuries with weather’ — and get instant visual answers.
Auto-Generated Dashboards
The AI creates interactive dashboards from your data automatically. Pin your best visualizations to the AI Reporting section for ongoing monitoring.
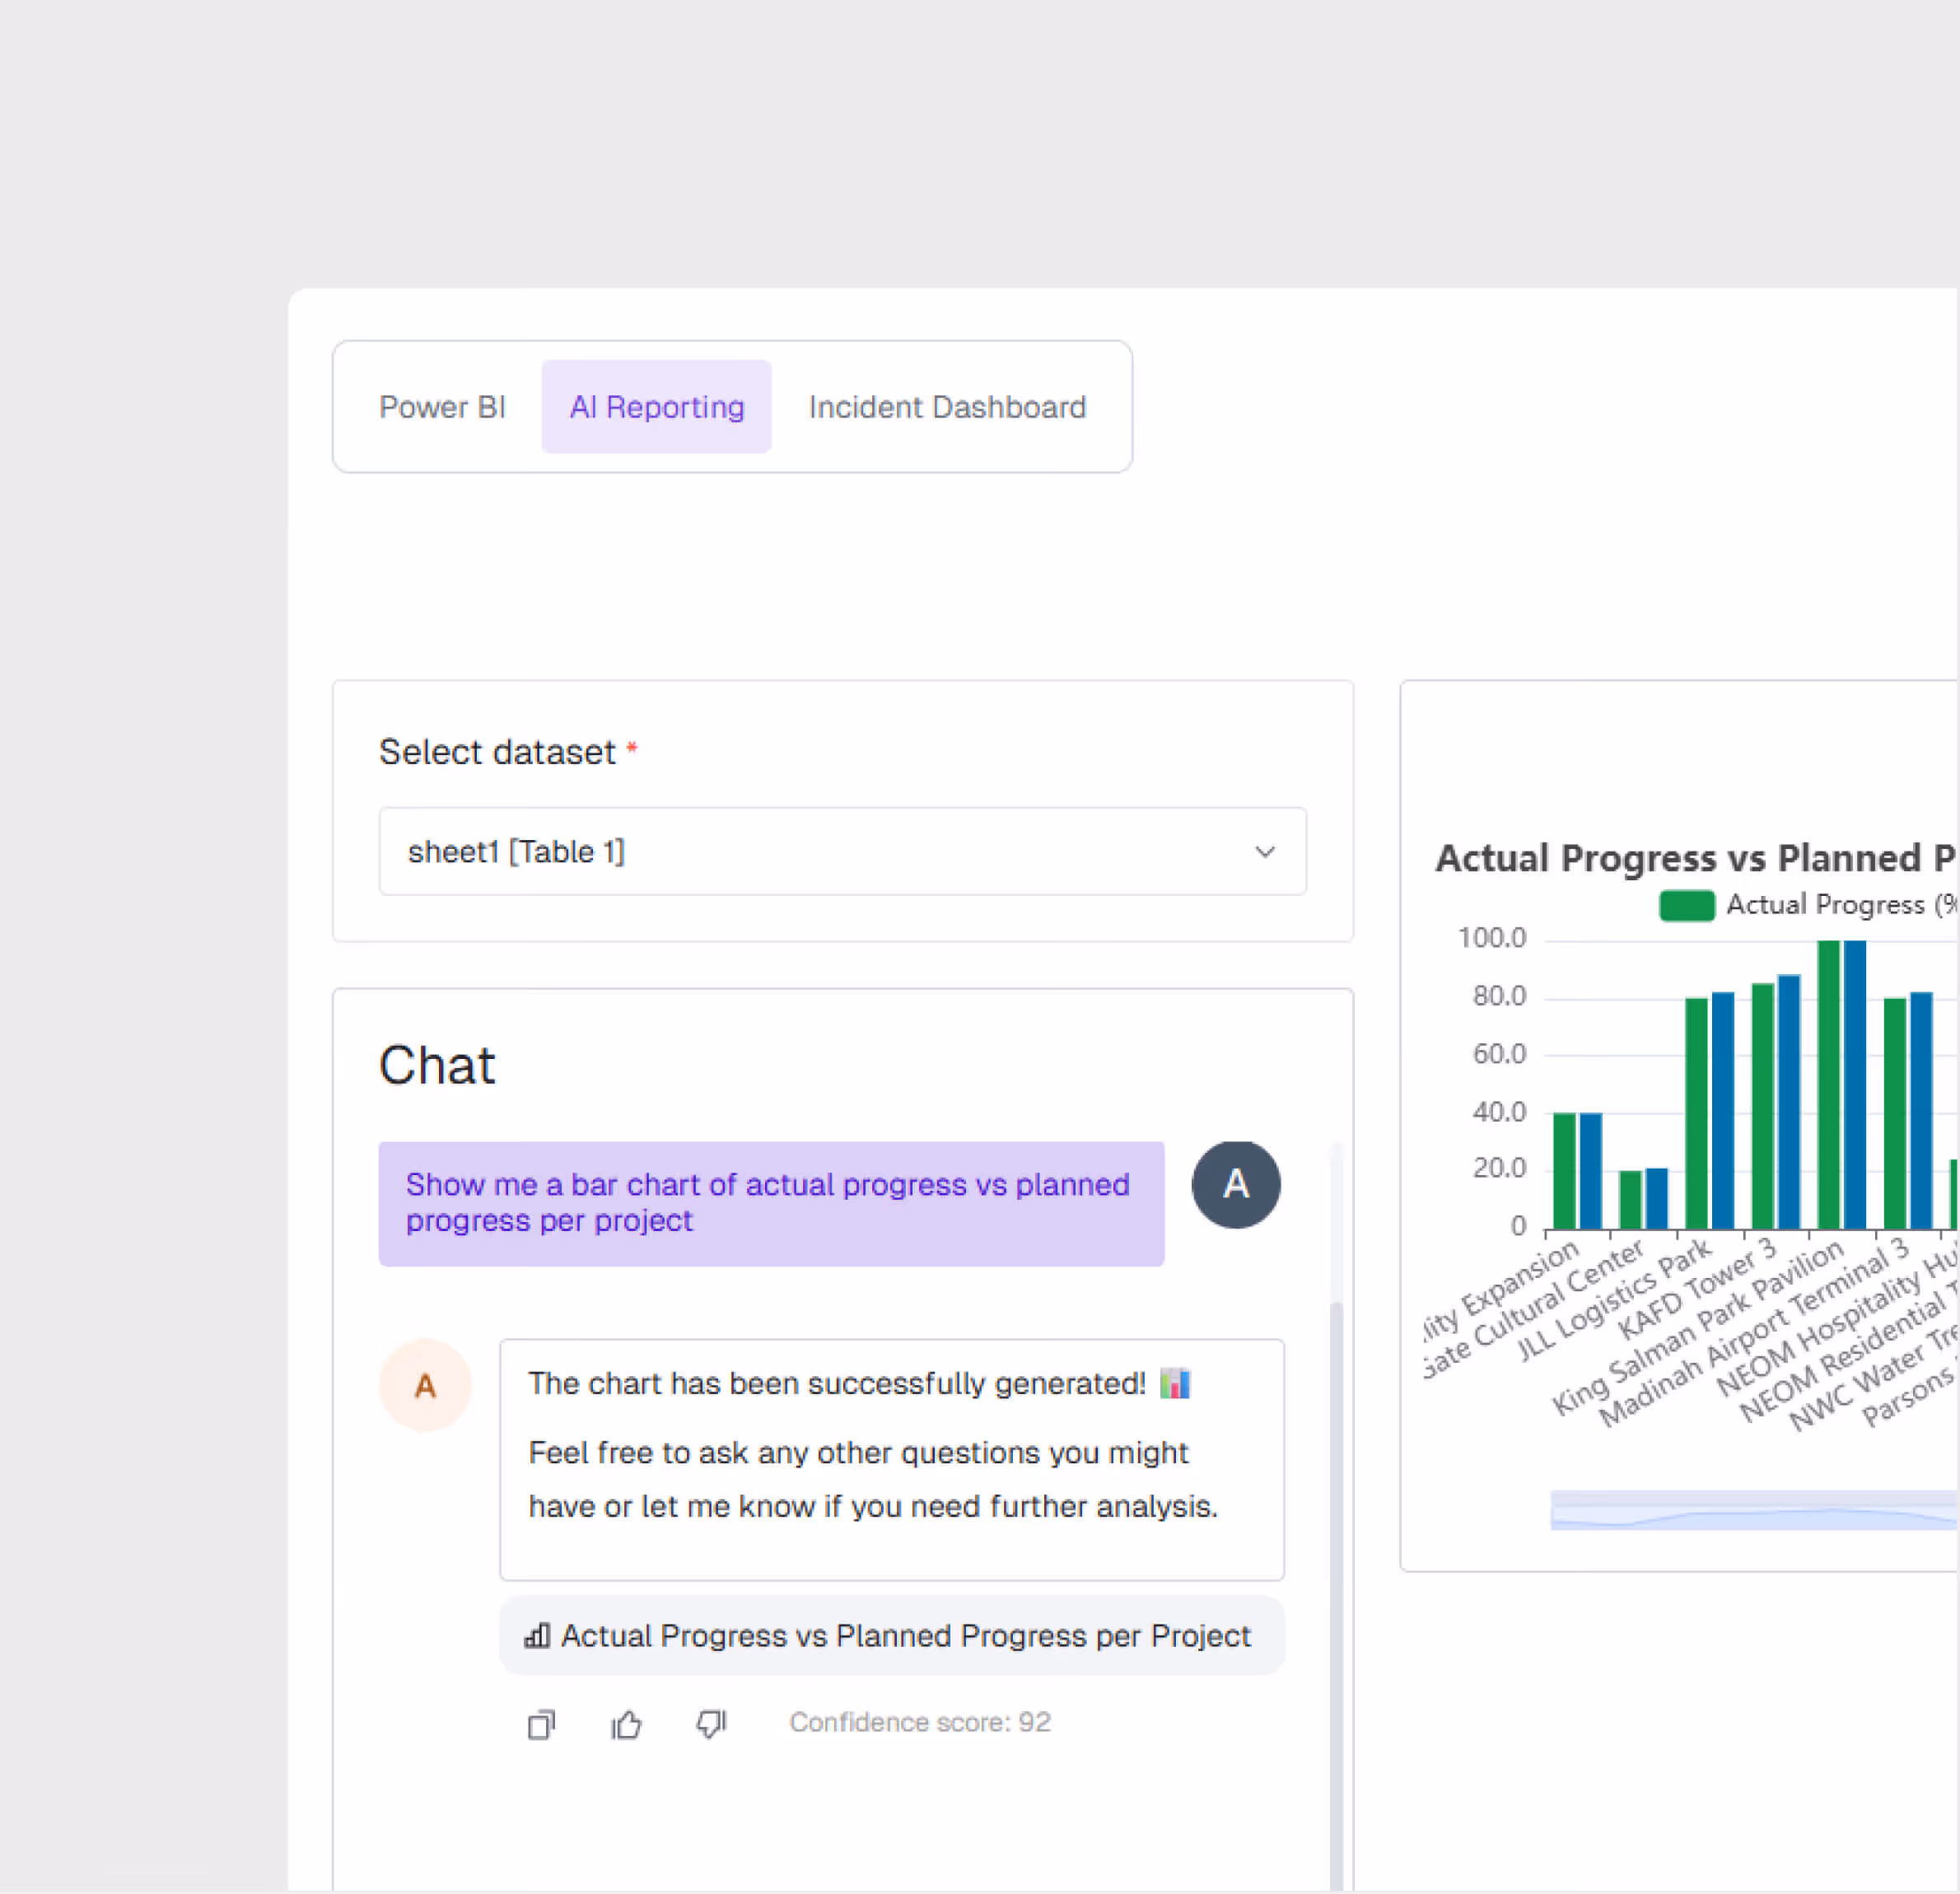
AI Analysis and Insights
Each chart uses AI to generate an analysis with summary, observations, patterns, predictions, and recommendations.
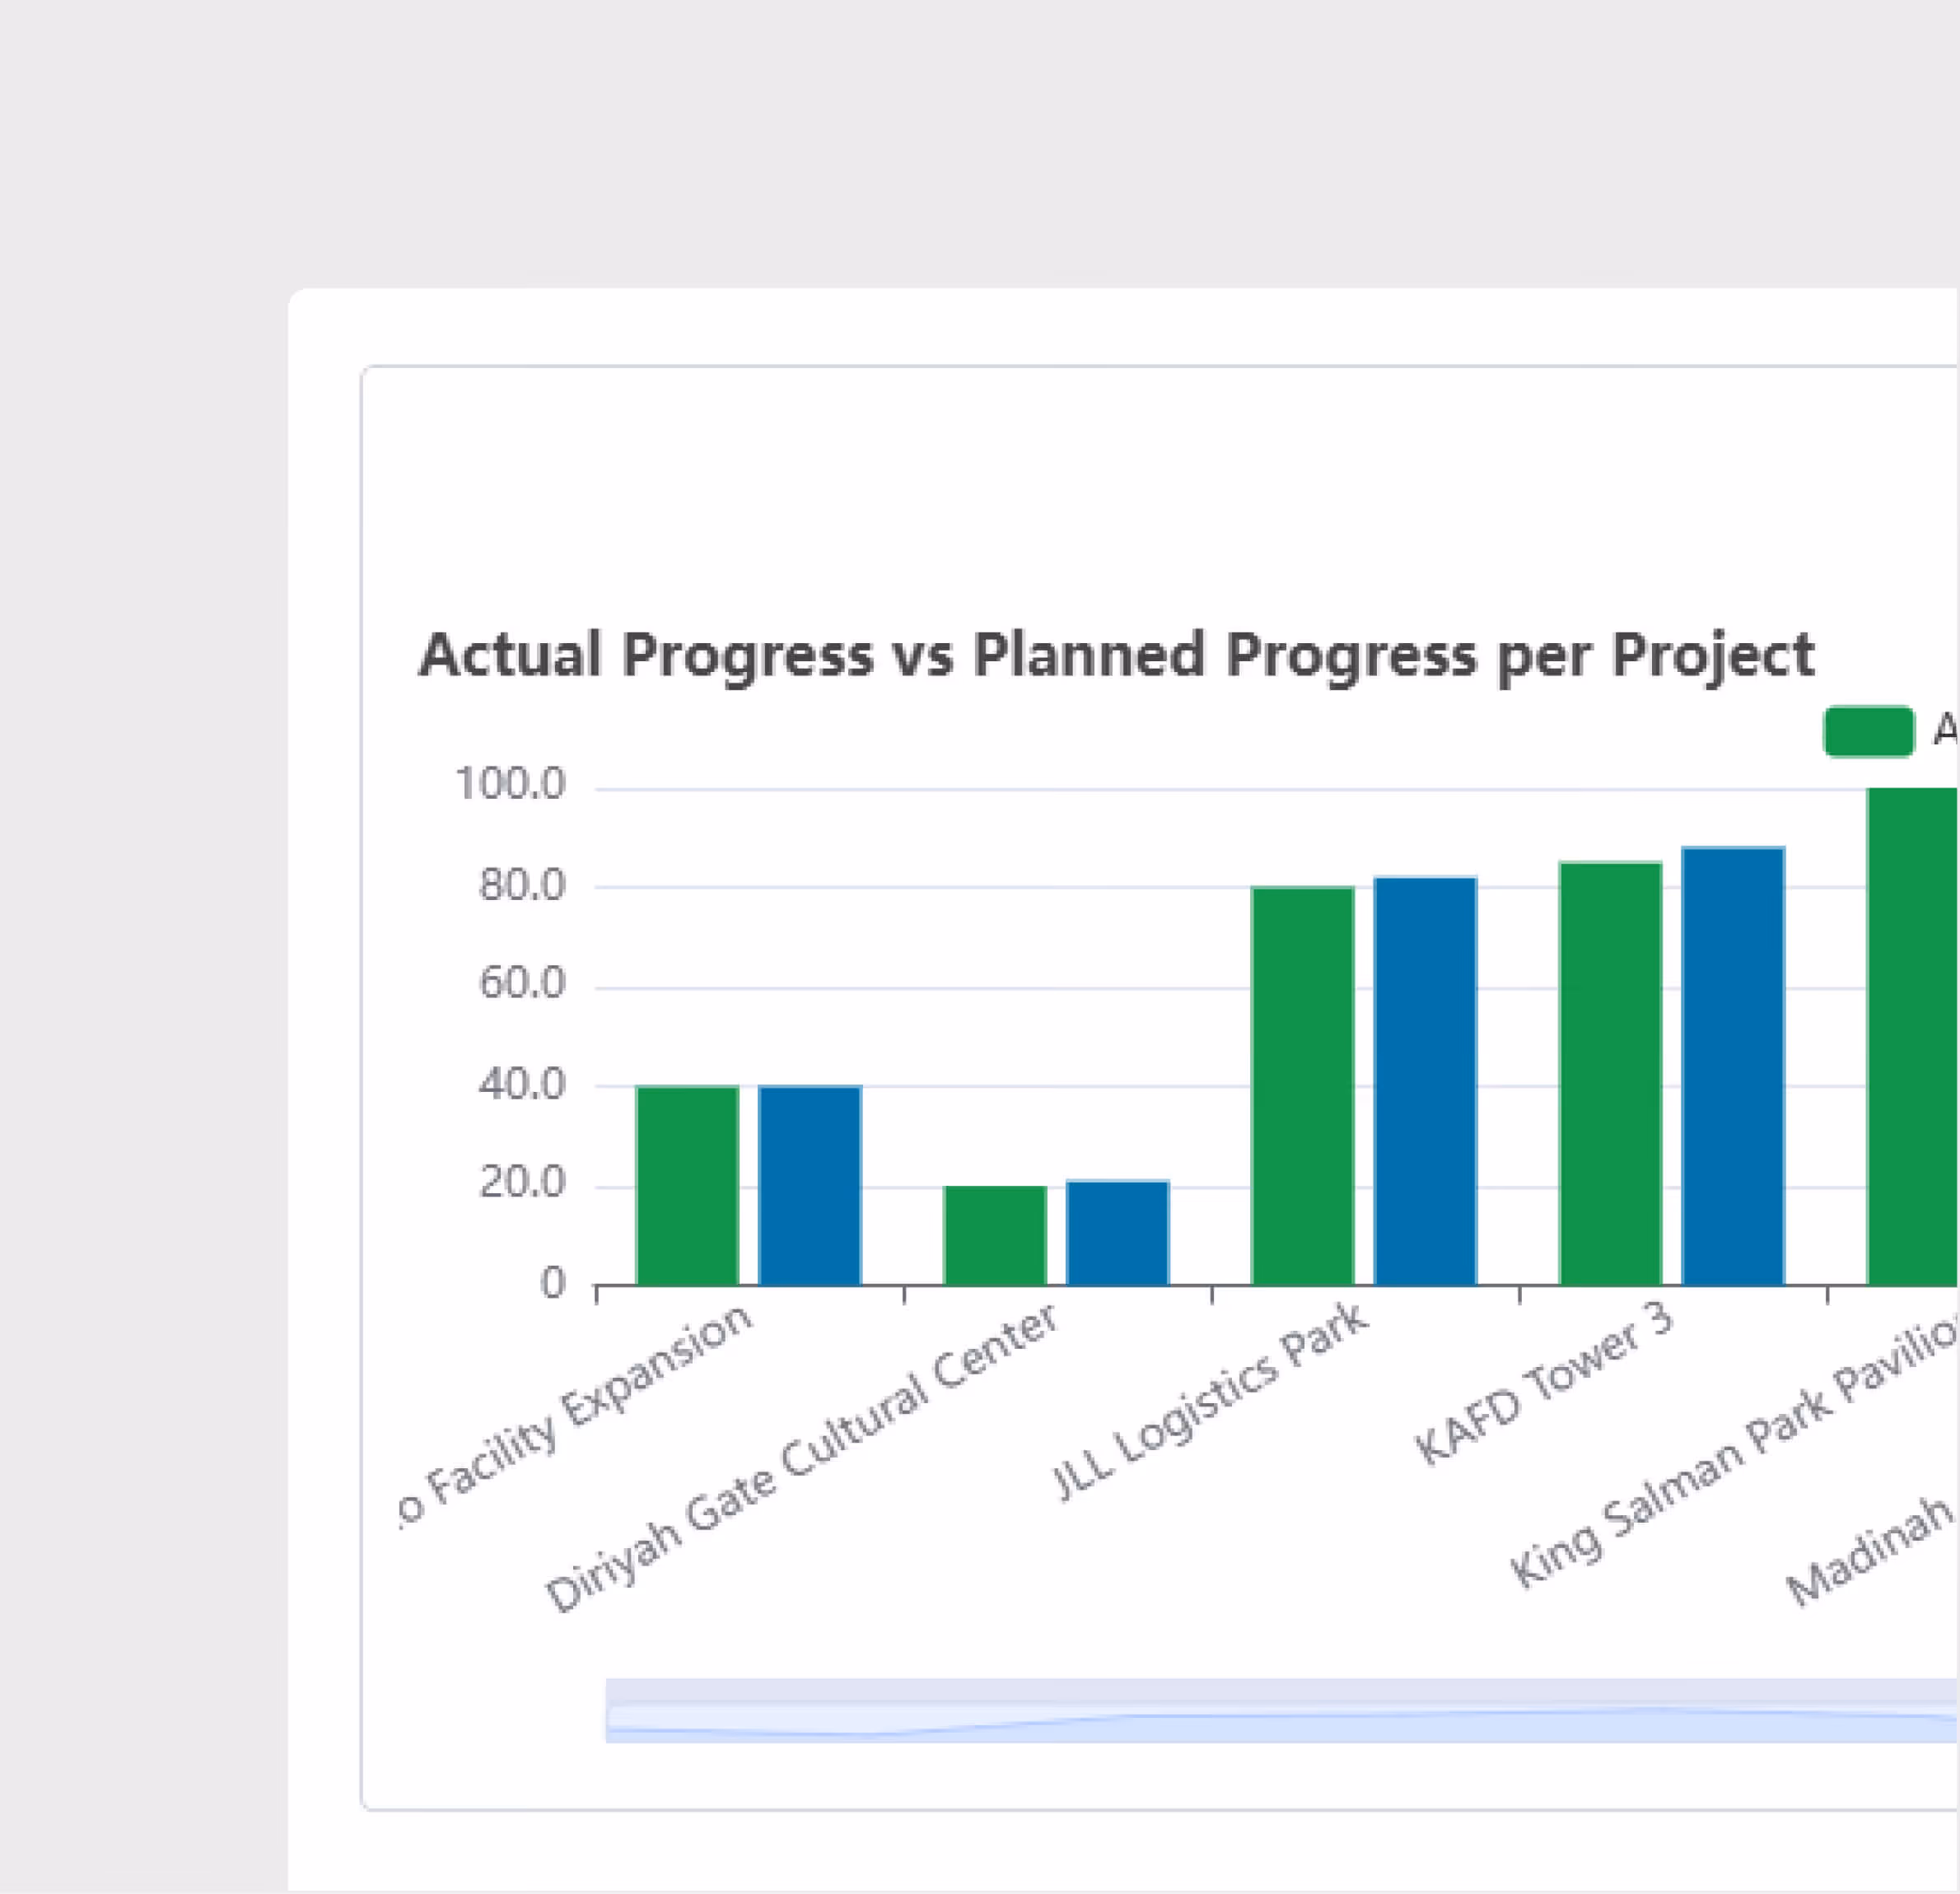
Interactive Visualizations
Generated charts and dashboards are fully interactive — filter, drill down, and explore your data visually without writing any queries.
Multi-Format Upload, Export & Share
Upload data from Excel or CSV and Export dashboards as PDF, CSV, or Excel. Print reports directly from the platform for distribution to stakeholders and management.
AI Data Analysis is most useful for:
Project Managers
Data-Driven Decision Making
Ask questions about your project data in plain language and get visual answers instantly — without waiting for the BI team to build a dashboard.
Executives
Portfolio Analytics
Analyze data across multiple projects with AI-generated dashboards. Upload portfolio data and get cross-project insights in minutes.
PMO Analysts and Managers
Operational Insights
Upload daily reports or site data and get visual breakdowns of production rates, resource utilization, and progress metrics without spreadsheet expertise.
"We used to spend 3 days a week manually consolidating reports and building a progress dashboard for the executive team. Now we spend 1 hour a week."
.avif)
Frequently asked questions
Auto-consolidated master records are downloadable for offline analysis in CSV and Excel file format.
Configure automated notification tasks with reminder intervals.
Yes. The template builder supports custom sections, fields, formulas, and approval workflows. Templates can be project-specific or standardized across the organization.
Sub-contractors submit reports using your templates. The engine automatically consolidates their data into master records, aggregating across all submissions with your defined functions.
Export equipment utilization reports, fleet trip histories, access logs, and safety zone incident reports in standard formats.
Yes. All monitored equipment and vehicles are displayed on the GIS map with real-time position updates, status indicators, and click-through details.
WhiteHelmet products AI Data Analysis works well with

Field Intelligence
