
AI Schedule
Plan, track and forecast your schedule in one place, with AI that explains delays and risks from the evidence.
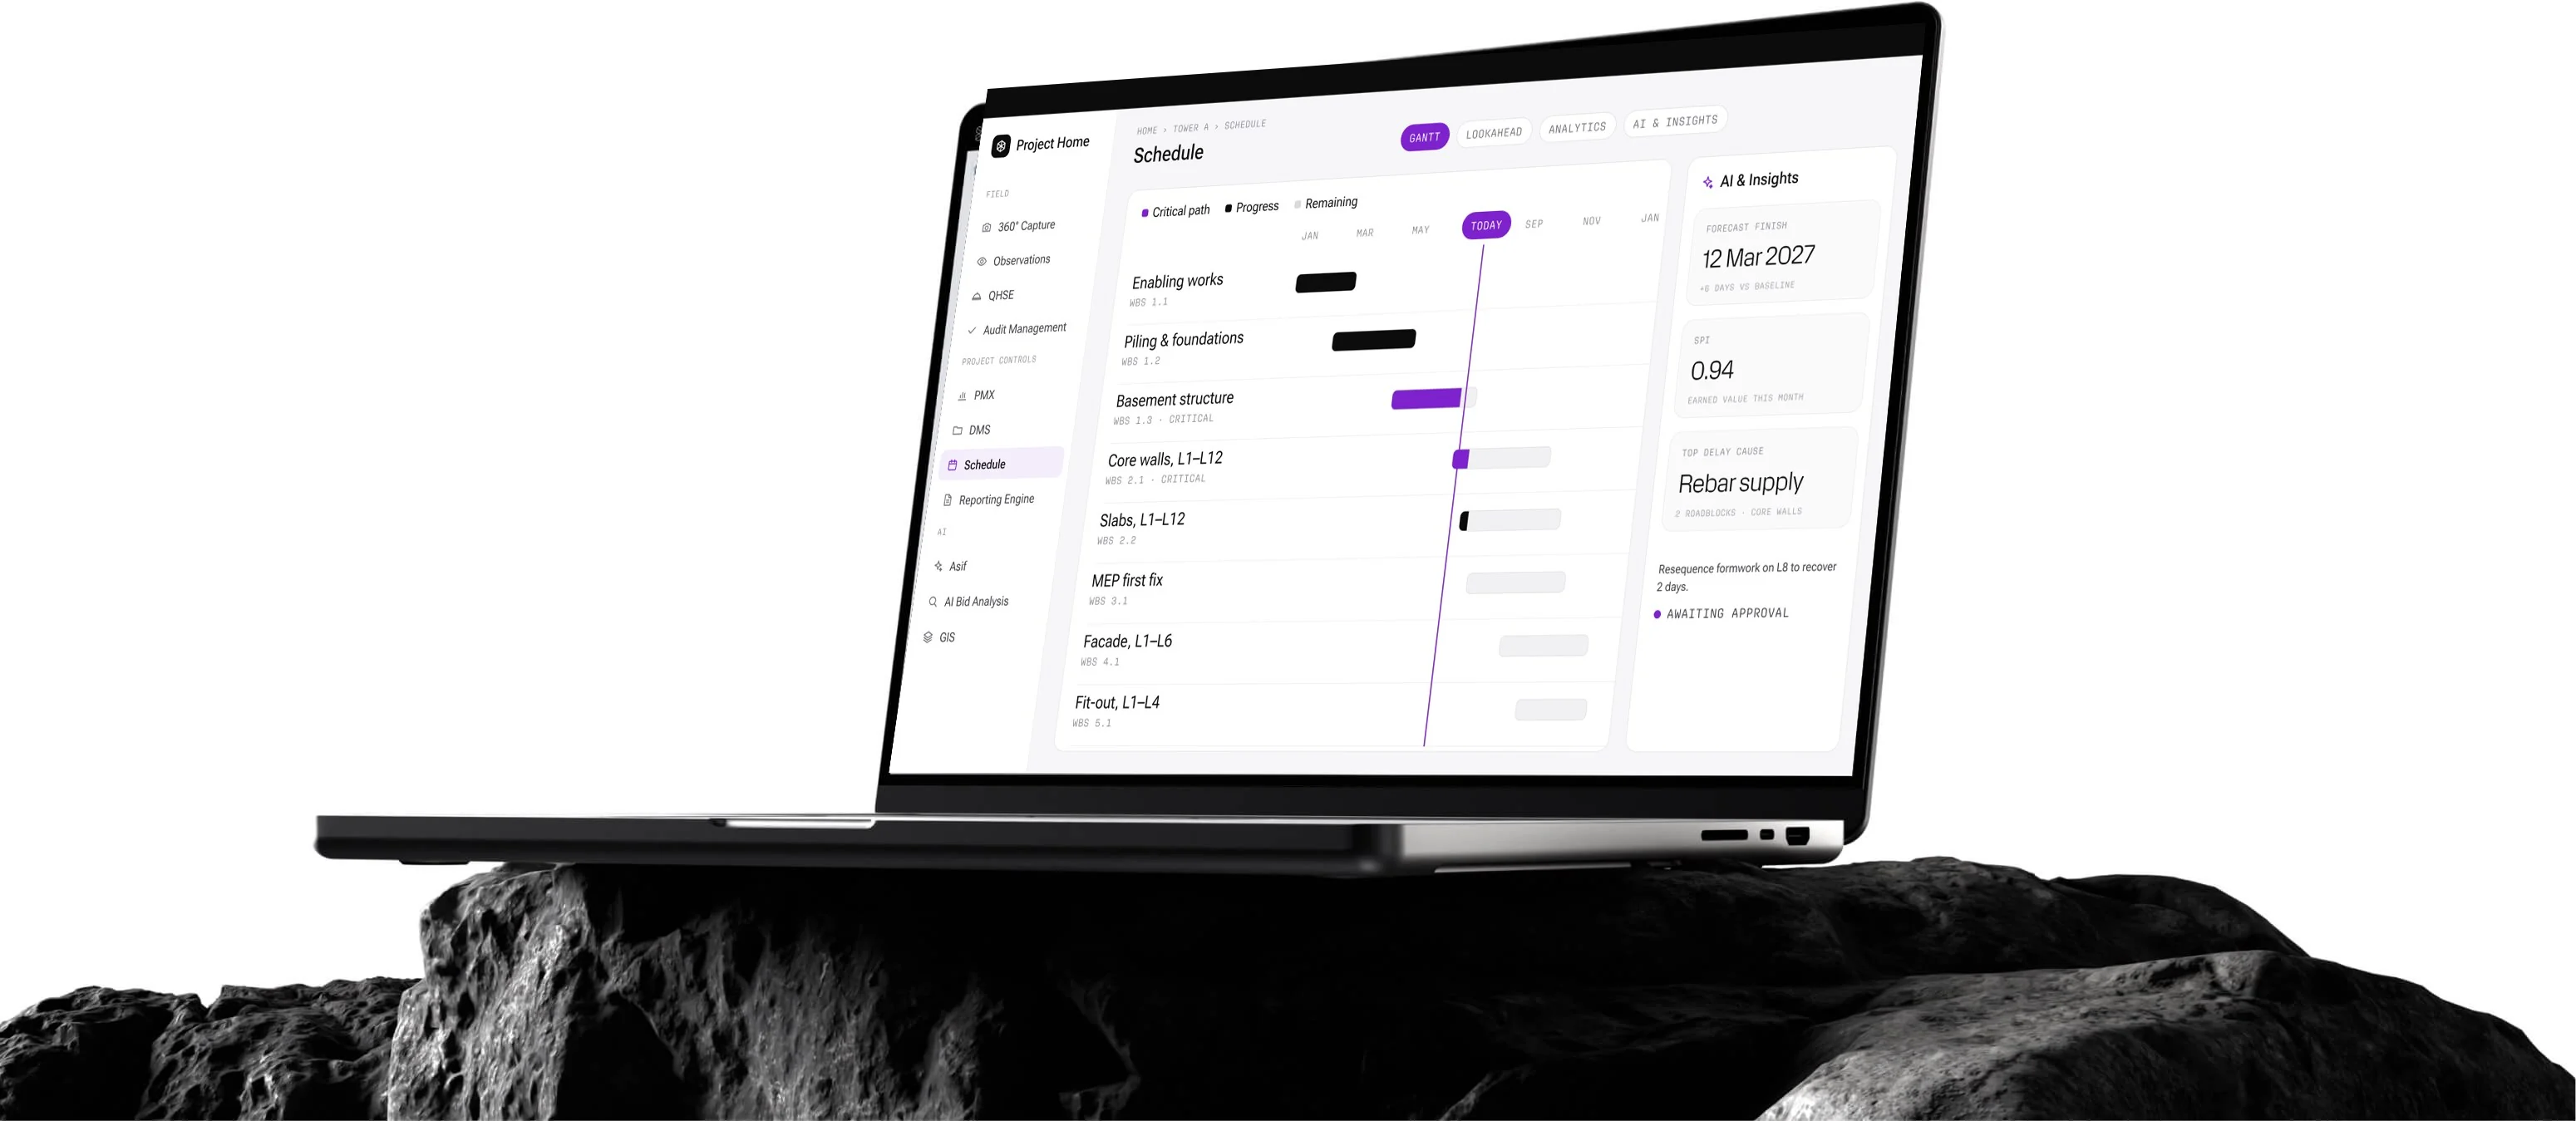
Plan with Evidence. Deliver on Time.
AI Schedule brings planning and site progress into one place. Planners build the work breakdown and Gantt in the browser or import it from Primavera P6, site teams report progress with photo and 360° evidence, and AI explains delays and risks with the sources behind them. AI never changes the schedule by itself: it proposes, and a person approves.
WBS & Gantt with Critical Path
Primavera P6 & Excel Import
Progress with Photo & 360° Evidence
Lookahead, Roadblocks & Change Requests
AI Delay & Risk Insights
Earned Value, SPI & Forecast Finish
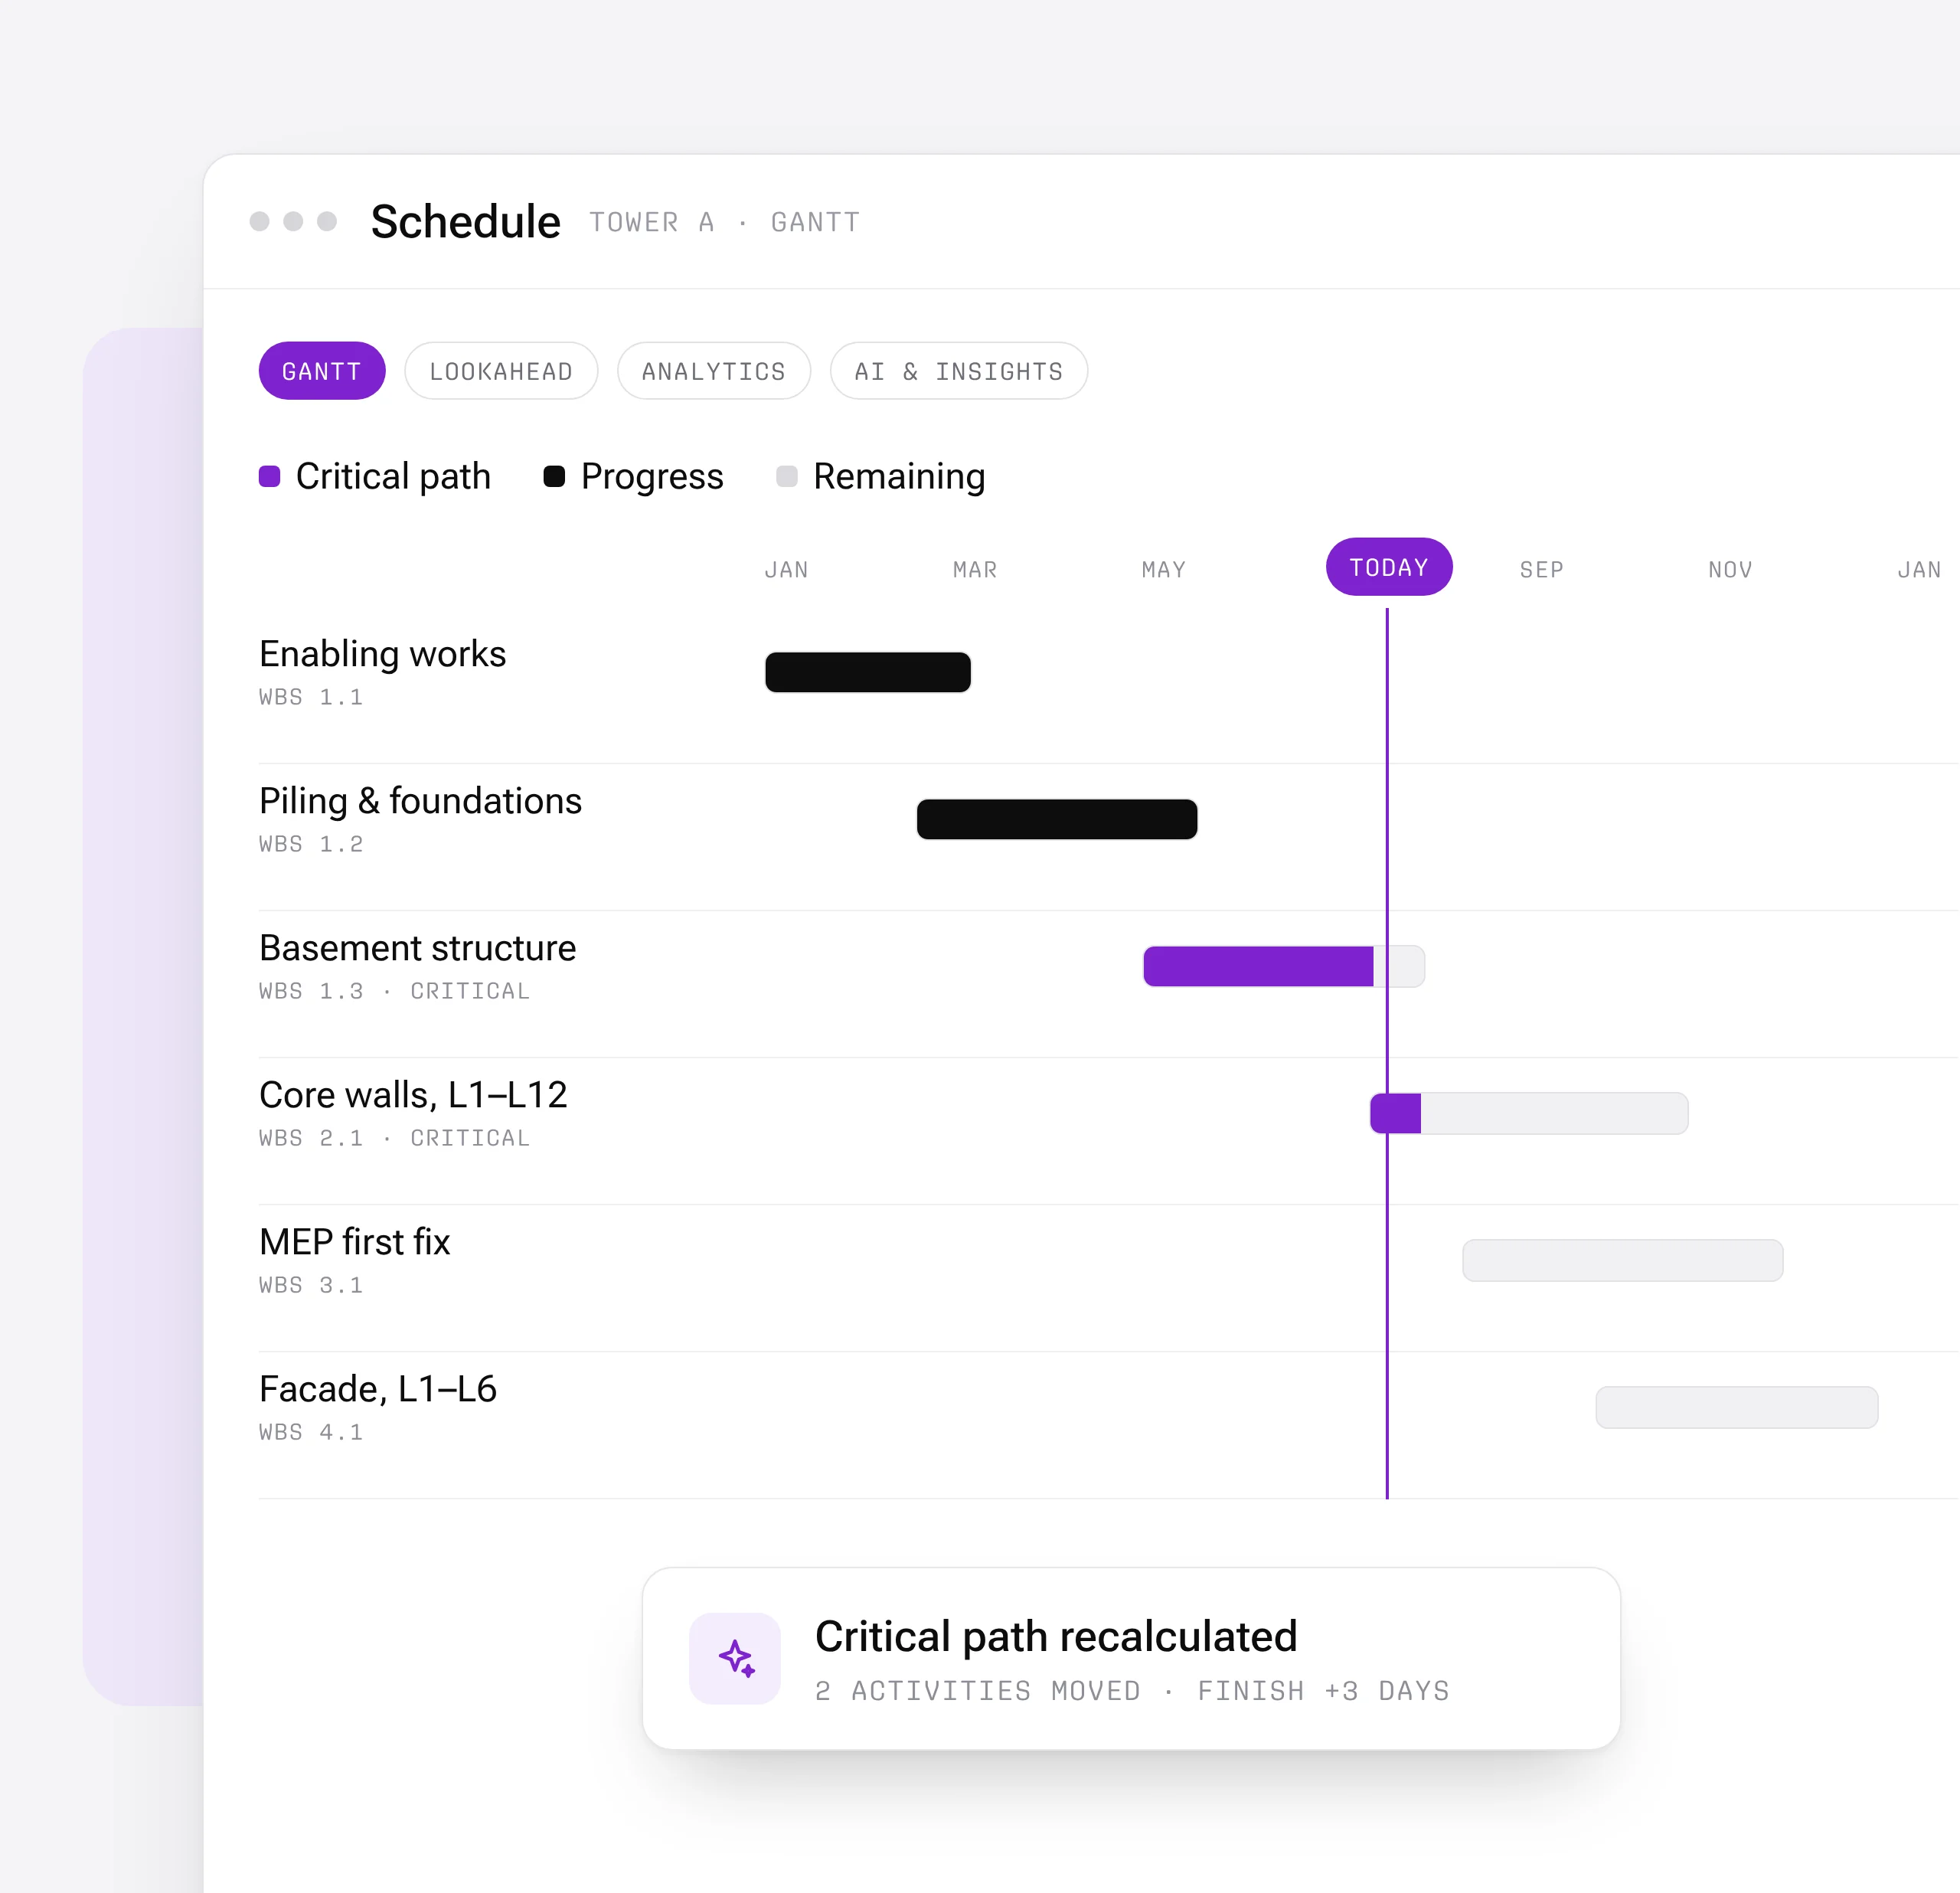
Work Breakdown & Gantt with Critical Path
Build the work breakdown and Gantt in the browser, or import it from Primavera P6 and Excel. The critical path updates as you plan, and AI can draft activities for you to review.
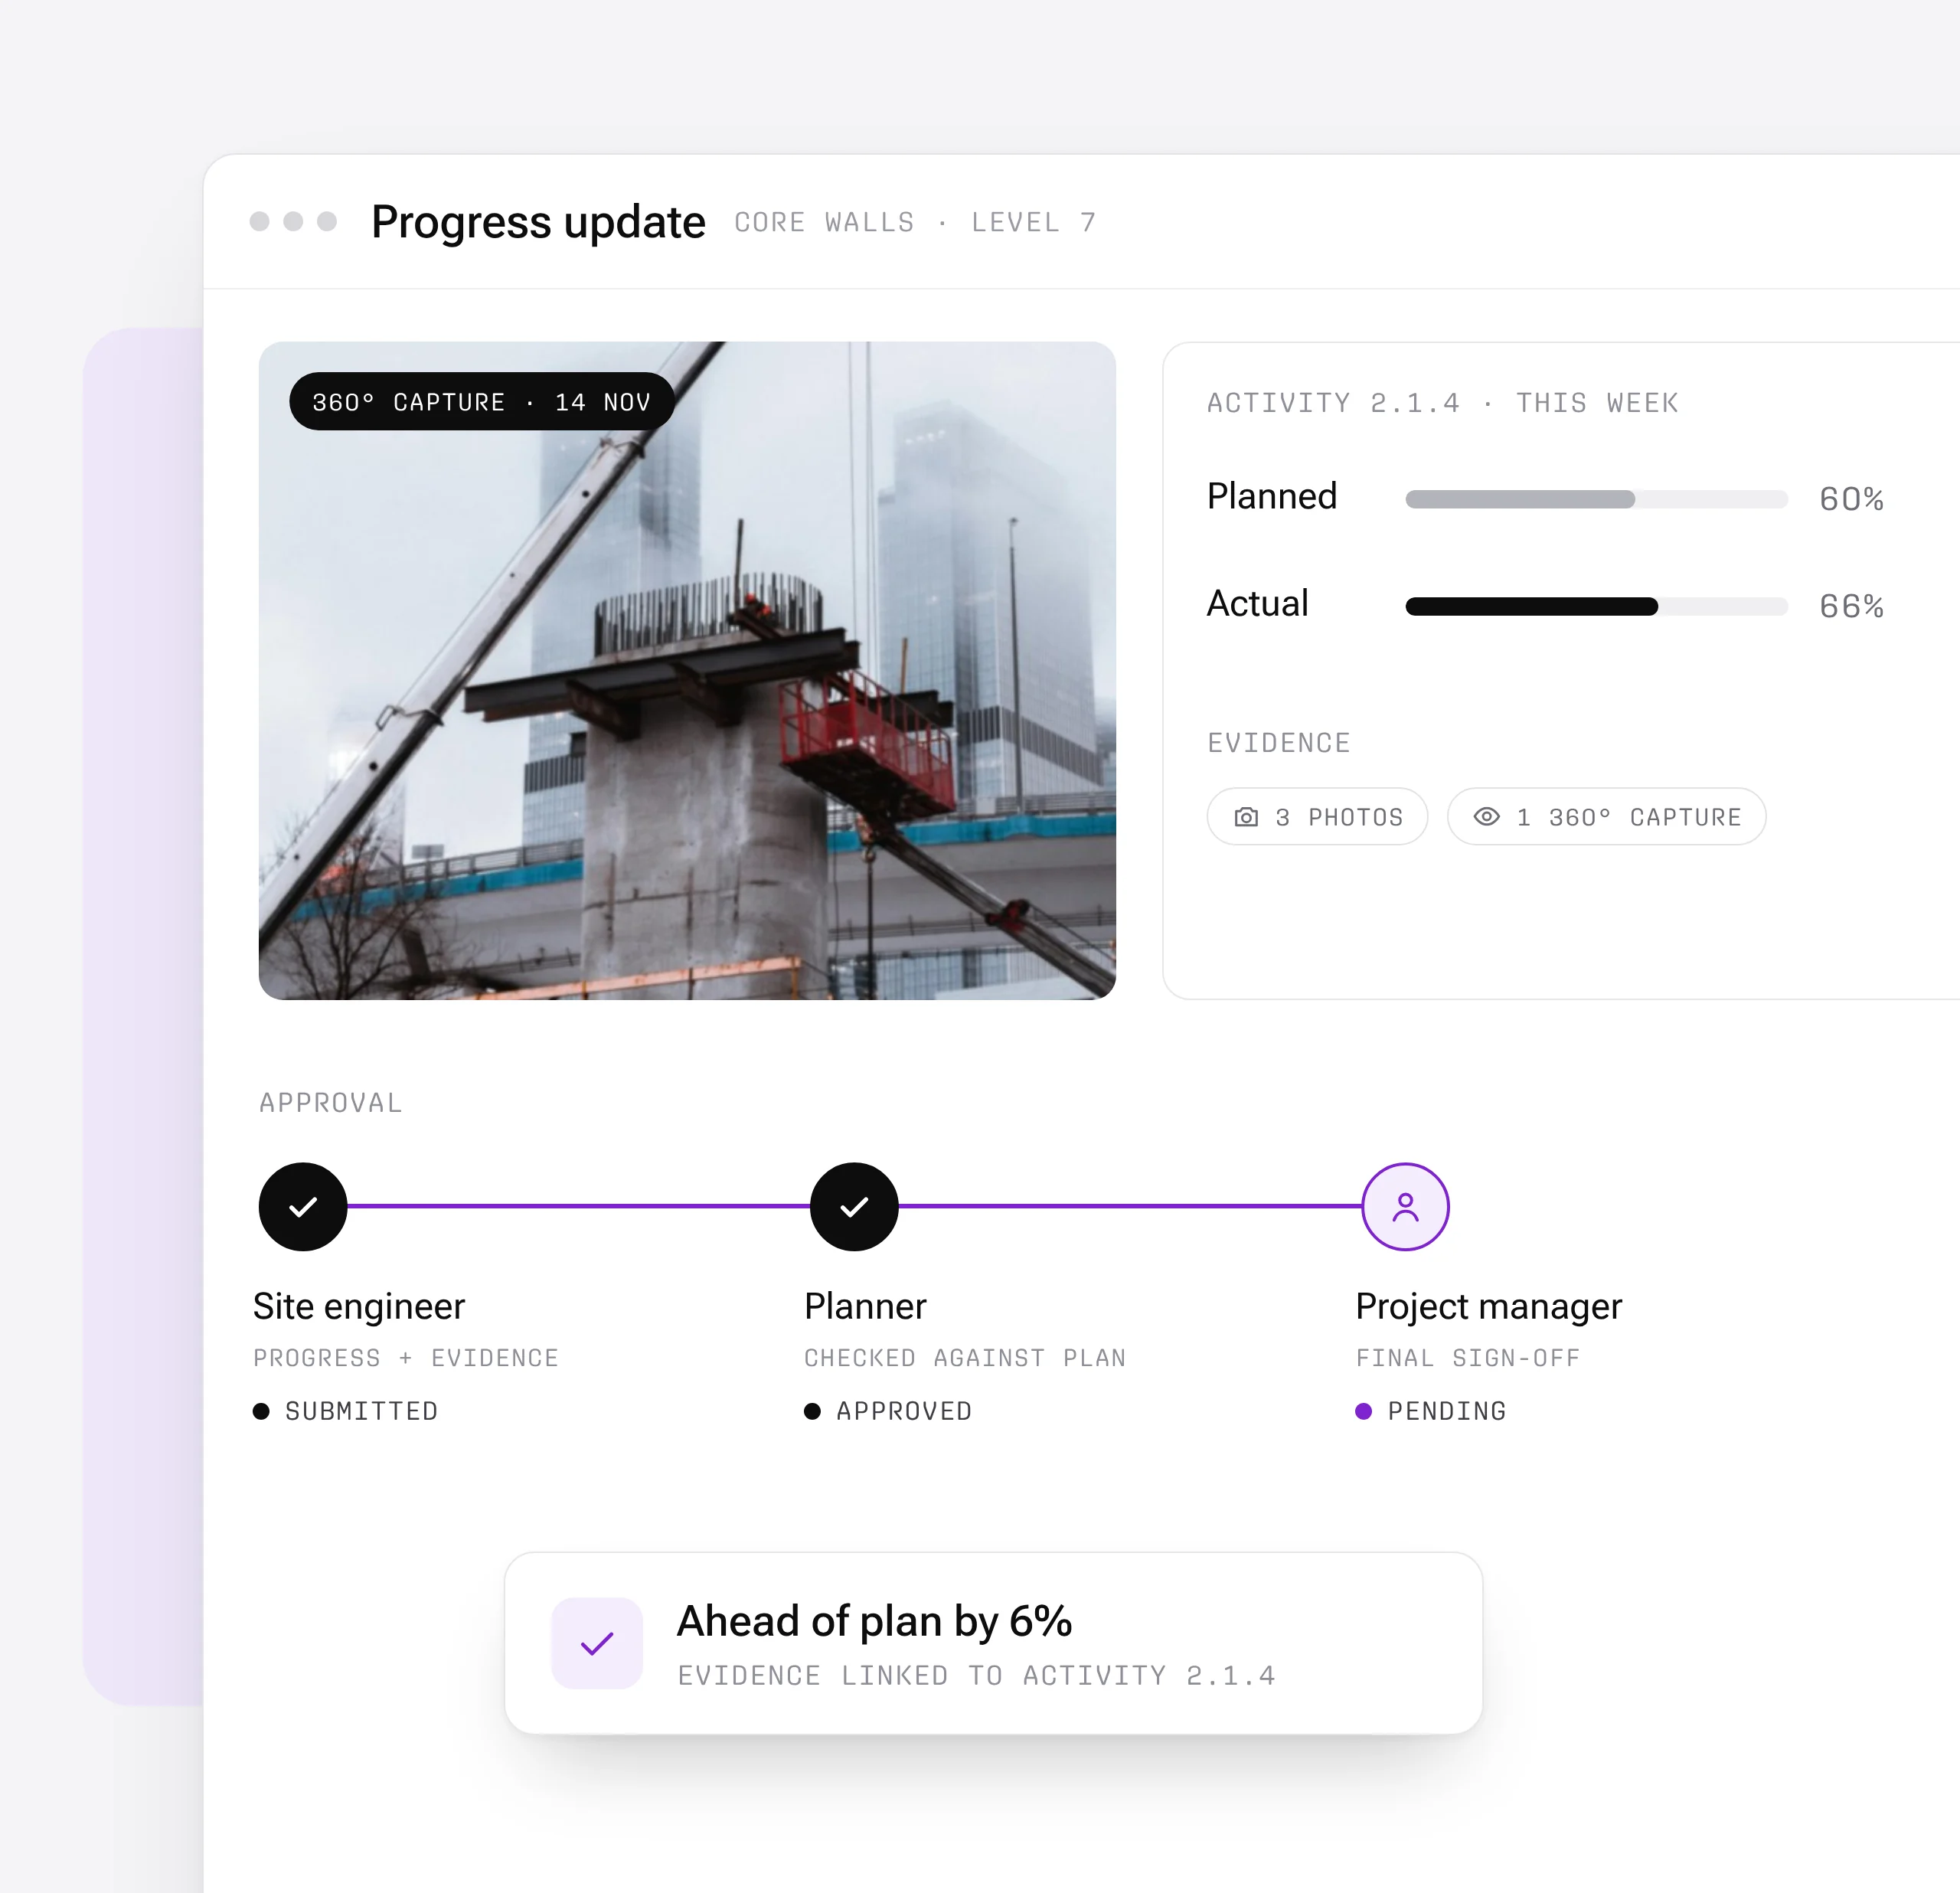
Progress with Evidence
Site teams update progress with photos and 360° captures linked to each activity, and every update goes through approval, so plan versus actual is always backed by what is on site.

Lookahead & Roadblocks
Plan the next one to six weeks on a board or a table, flag roadblocks before they stop work, and raise schedule change requests with their impact on the programme.
AI Delay & Risk Insights
AI summarizes the schedule, explains the causes of delay and flags risks, with the evidence behind every finding. It proposes; a person approves.

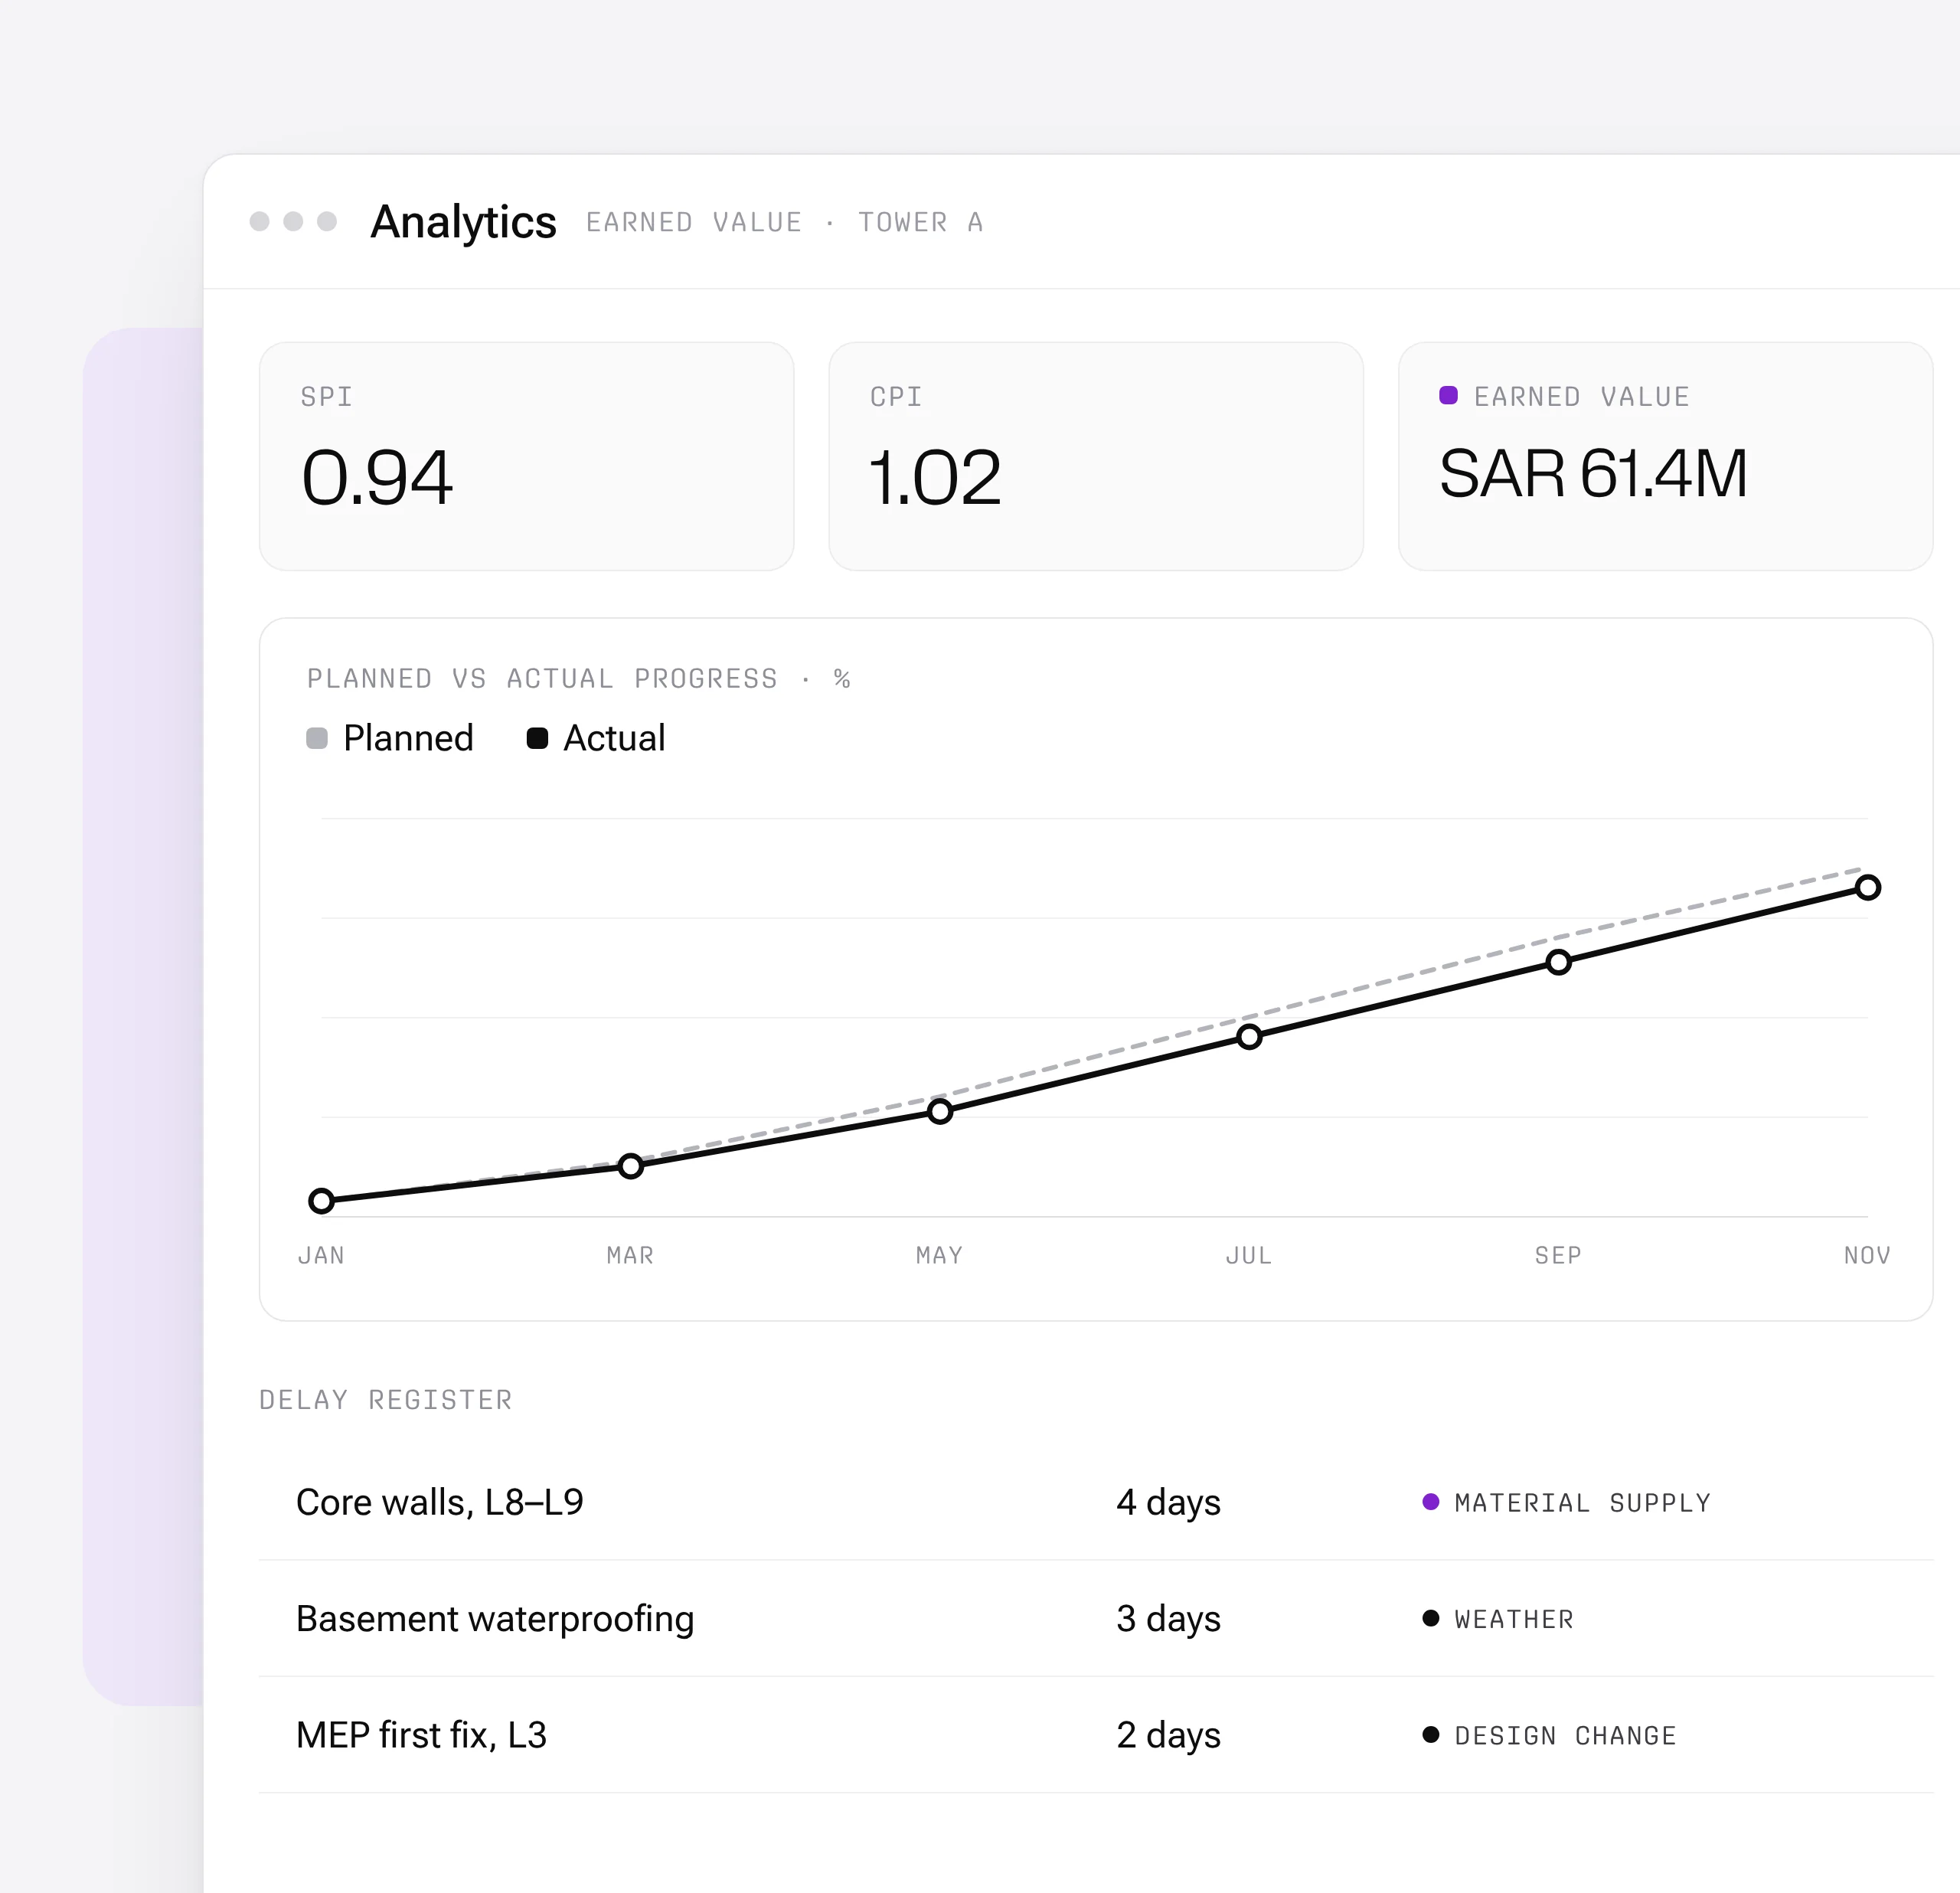
Earned Value & Forecast
Track earned value, SPI and the forecast finish date, keep a delay register, and share an executive dashboard with leadership.
AI Schedule is most useful for:
Planners & Schedulers
One Live Schedule
Build and update the programme in one place, import P6 schedules, and keep the critical path current as the site reports progress.
Site Engineers
Progress with Proof
Report progress from site with photos and 360° captures linked to each activity, and raise roadblocks before they stop work.
Project Directors
Forecasts You Can Trust
See the forecast finish, earned value and the causes of delay, with the evidence behind each one, before they become claims.
"WhiteHelmet streamlined our operations, cut site visits in half, and brought real progress to every aspect of our work."
Frequently asked questions
Yes. All geo-tagged incidents are displayed on the GIS map, enabling spatial analysis of incident patterns and high-risk zone identification.
GIS 3D supports IFC and RVT for BIM models, LAS/LAZ for point clouds, and standard image formats for drone orthomosaics and aerial imagery.
Yes. GIS 2D and GIS 3D share the same geospatial foundation. You can switch between 2D planning views and 3D visualization views seamlessly.
When an incident is logged, the user selects the appropriate SOP-based workflow based on incident type and severity, guiding investigators through each required step.
WhiteHelmet products AI Schedule works well with

Field Intelligence
